Looking back, it's been now over five years since I left Python for JavaScript.
That was when I realized Node.js had matured and was good enough for running applications in production. That was when I realized SSR applications were the future — they made things easier, faster, reduced friction and context switching in development. JavaScript became a universal language, one I could use not only for the browser but also for nearly all my backend needs.
That doesn't mean it's not without its challenges.
The first thing you learn when taking Node.js applications to production, is that it likes memory, a lot. And it's embarassingly easy to shoot yourself in the foot and make it like memory even more. In one of my first client gigs where I delivered a Node.js application, when the time came to deploy, my final recommendation was to use 8GB RAM in all instances running Node.js, and use ridiculously high setting for --max-old-space-size, and pm2 in cluster mode, so that individual instances could die and restart automatically. I didn't know any better.
The Mysterious v8 Heap Size
So... about that — it's ridiculously hard to find official documentation on how Node.js configures its v8 heap size. I asked on Twitter, to no avail. You can find a gist, linking to a StackOverflow thread, a GitHub issue, some very useful pieces on debugging memory leaks and optimizing memory usage, but no official documentation piece detailing how it's determined by default.
In short, latest versions of Node.js will automatically set it based on the available memory, e.g., it doesn't use all of it — but you can still shrink or expand it with --max-old-space-size according to your needs, if you know what you're doing.
You can see what is set on your application with:
const v8 = require('v8')
const { heap_size_limit } = v8.getHeapStatistics()
console.log(`${(heap_size_limit / 1024 ** 3).toFixed(2)}GB`)
On my 8GB RAM MacBook, Node.js will set its heap size to 2GB. This might make sense on my personal computer, but on a server, you might want to push it a little higher depending on the application load and available resources to handle it.
Problematic Node.js Applications
Problematic Node.js applications exhibit four common behaviors:
-
low throughput, which corresponds to the number of requests your app is able to complete successfully — not necessarily requests per second.
-
excessive CPU utilization, which directly affects Node.js throughput by blocking the event loop — every time you're running JavaScript code, you're blocking it.
-
excessive memory utilization, typically the result of memory leaks by faulty JavaScript code, e.g., lingering event listeners, lingering global references, unhandled exceptions or promise rejections etc.
-
excessive event loop utilization: to quote Trevor Norris in his excellent piece, event loop utilization (or ELU) is the ratio of time the event loop is not idling in the event provider to the total time the event loop is running.
Node.js is single-threaded, with the event loop acting as a central coordinator of the program, scheduling and executing functions in response to events. The event loop operates in a continuous cycle, checking the message queue for new messages and executing their associated handlers. Each iteration of the event loop is known as a tick. The event loop will continue running until there are no more messages in the queue, or the process is explicitly terminated.
It is at this point you'll realize everything is connected: high CPU utilization can indicate that the event loop is being heavily taxed and that it may be time-sensitive, and high memory usage can indicate that the event loop is being blocked by a memory leak or that there is a high volume of objects in memory.
The Available Open Source Toolset
Debugging performance issues starts with benchmarking, and the #1 tool for benchmarking Node.js applications is autocannon. It can run load tests with a number of parameters, and collects request latency and volume statistics:
$ autocannon http://localhost:3000

Running 10s test @ http://localhost:3000
10 connections

┌─────────┬──────┬──────┬───────┬──────┬─────────┬─────────┬──────────┐
│ Stat    │ 2.5% │ 50%  │ 97.5% │ 99%  │ Avg     │ Stdev   │ Max      │
├─────────┼──────┼──────┼───────┼──────┼─────────┼─────────┼──────────┤
│ Latency │ 0 ms │ 0 ms │ 0 ms  │ 1 ms │ 0.02 ms │ 0.16 ms │ 16.45 ms │
└─────────┴──────┴──────┴───────┴──────┴─────────┴─────────┴──────────┘
┌───────────┬─────────┬─────────┬─────────┬─────────┬─────────┬─────────┬─────────┐
│ Stat      │ 1%      │ 2.5%    │ 50%     │ 97.5%   │ Avg     │ Stdev   │ Min     │
├───────────┼─────────┼─────────┼─────────┼─────────┼─────────┼─────────┼─────────┤
│ Req/Sec   │ 20623   │ 20623   │ 25583   │ 26271   │ 25131.2 │ 1540.94 │ 20615   │
├───────────┼─────────┼─────────┼─────────┼─────────┼─────────┼─────────┼─────────┤
│ Bytes/Sec │ 2.29 MB │ 2.29 MB │ 2.84 MB │ 2.92 MB │ 2.79 MB │ 171 kB  │ 2.29 MB │
└───────────┴─────────┴─────────┴─────────┴─────────┴─────────┴─────────┴─────────┘

Req/Bytes counts sampled once per second.

251k requests in 10.05s, 27.9 MB read
Then there's Clinic.js — a suite of tools that help debugging Node.js performance issues. Clinic Doctor collects general process metrics, Clinic Bubbleprof tracks latency between asynchronous operations, Clinic Flame wraps 0x to help navigating CPU flamegraphs and Clinic HeapProfiler lets you visualize memory usage in a friendly way. Clinic is the most underrated and underused tool in the Node.js ecosystem, I'm constantly amazed at how few people have heard of it.
All Clinic.js tools integrate with autocannon (and other load testing tools) to let you monitor your app through the load test — for instance, to get general process metrics during an autocannon run you can do:
clinic doctor --autocannon [ / --method POST ] -- node server.js
And that will get you a nice UI with all basic process metrics, like CPU and memory usage, but also event loop delay and asynchronous I/O activity.
Clinic.js runs locally on your computer and is meant for debugging purposes only. If you want to collect metrics on live services, you enter the realm of APM — Application Performance Management tools, that can collect, aggregate and display real-time quantitative data about your application.
The most popular open source option for implementing an APM system is the combination of Prometheus and Grafana. Prometheus lets you collect and store metrics as time series data, while Grafana allows you to visualize data from tools like Prometheus. In order to use this combo for monitoring a Node.js application, aside from the need to run and maintain working instances of both tools, you need to expose a metrics endpoint. Prometheus will pull metrics from that endpoint every minute by default. Integration can happen manually via the prom-client package, or an automated plugin like this one for Fastify.
Then There's N|Solid
N|Solid is a well maintained fork of Node.js that adds APM capabilities to it — more precisely, it bundles a C++ component called N|Solid Agent within Node.js, which collects detailed process metrics.
There are N|Solid counterparts for all LTS Node.js releases, currently v14, v16 and v18. And installing them is as easy as npm install -g nsolid.
Running N|Solid is the same as running Node.js, the difference is that it bundles that extra C++ component for observing the process health and collecting metrics. N|Solid was built by former and active contributors to the Node.js project itself.
When you install N|Solid via npm (it can also be installed via Homebrew and a number of other different ways), it'll add a .nsolid-bundle directory to your $HOME containing all Node.js LTS-compatible runtimes and the N|Solid Console.
You can then add the bin folder for your desired LTS version in your $PATH and you can start using nsolid instead of node. The nsolid binary version matching your currently enabled Node.js version should be instantly available.
.nsolid-bundle/4.9.0
.nsolid-bundle/4.9.0/console
.nsolid-bundle/4.9.0/nsolid-fermium
.nsolid-bundle/4.9.0/nsolid-gallium
.nsolid-bundle/4.9.0/nsolid-hydrogen
N|Solid Console is to N|Solid Agent as Grafana is to Prometheus, providing a way to visualize and navigate through the metrics collected by the built-in N|Solid Agent component. The difference between running N|Solid and Node.js with Prometheus and Grafana, for example, is that N|Solid Agent runs on its own separate thread, isolated from the Node.js event loop, which means it's able to collect metrics in a much, much more efficient manner.
How efficient? Datadog, a competing APM solution, is able to process 11k requests per second. N|Solid is able to process 54k requests per second.
N|Solid achieves this by collecting metrics with the least amount of overhead. Instead of patching up Node.js with native add-ons, N|Solid can hook deep into the Node.js core, because well, it is Node.js.
You can use N|Solid and N|Solid Console together locally for development, serving the same purpose as Clinic.js — but N|Solid Console shines as an on-prem solution — you can run it on your infrastructure, like Prometheus.
N|Solid Console is not free for commercial use — it requires a license, with custom pricing for enterprise customers. It is free for development though, and it can provide many of the same features as Clinic.js and more.
But you don't have to run it yourself — there's N|Solid SaaS — essentially a managed cluster of N|Solid Console instances. It's free up to four processes. If you go to accounts.nodesource.com and sign-up, you get to this final step:
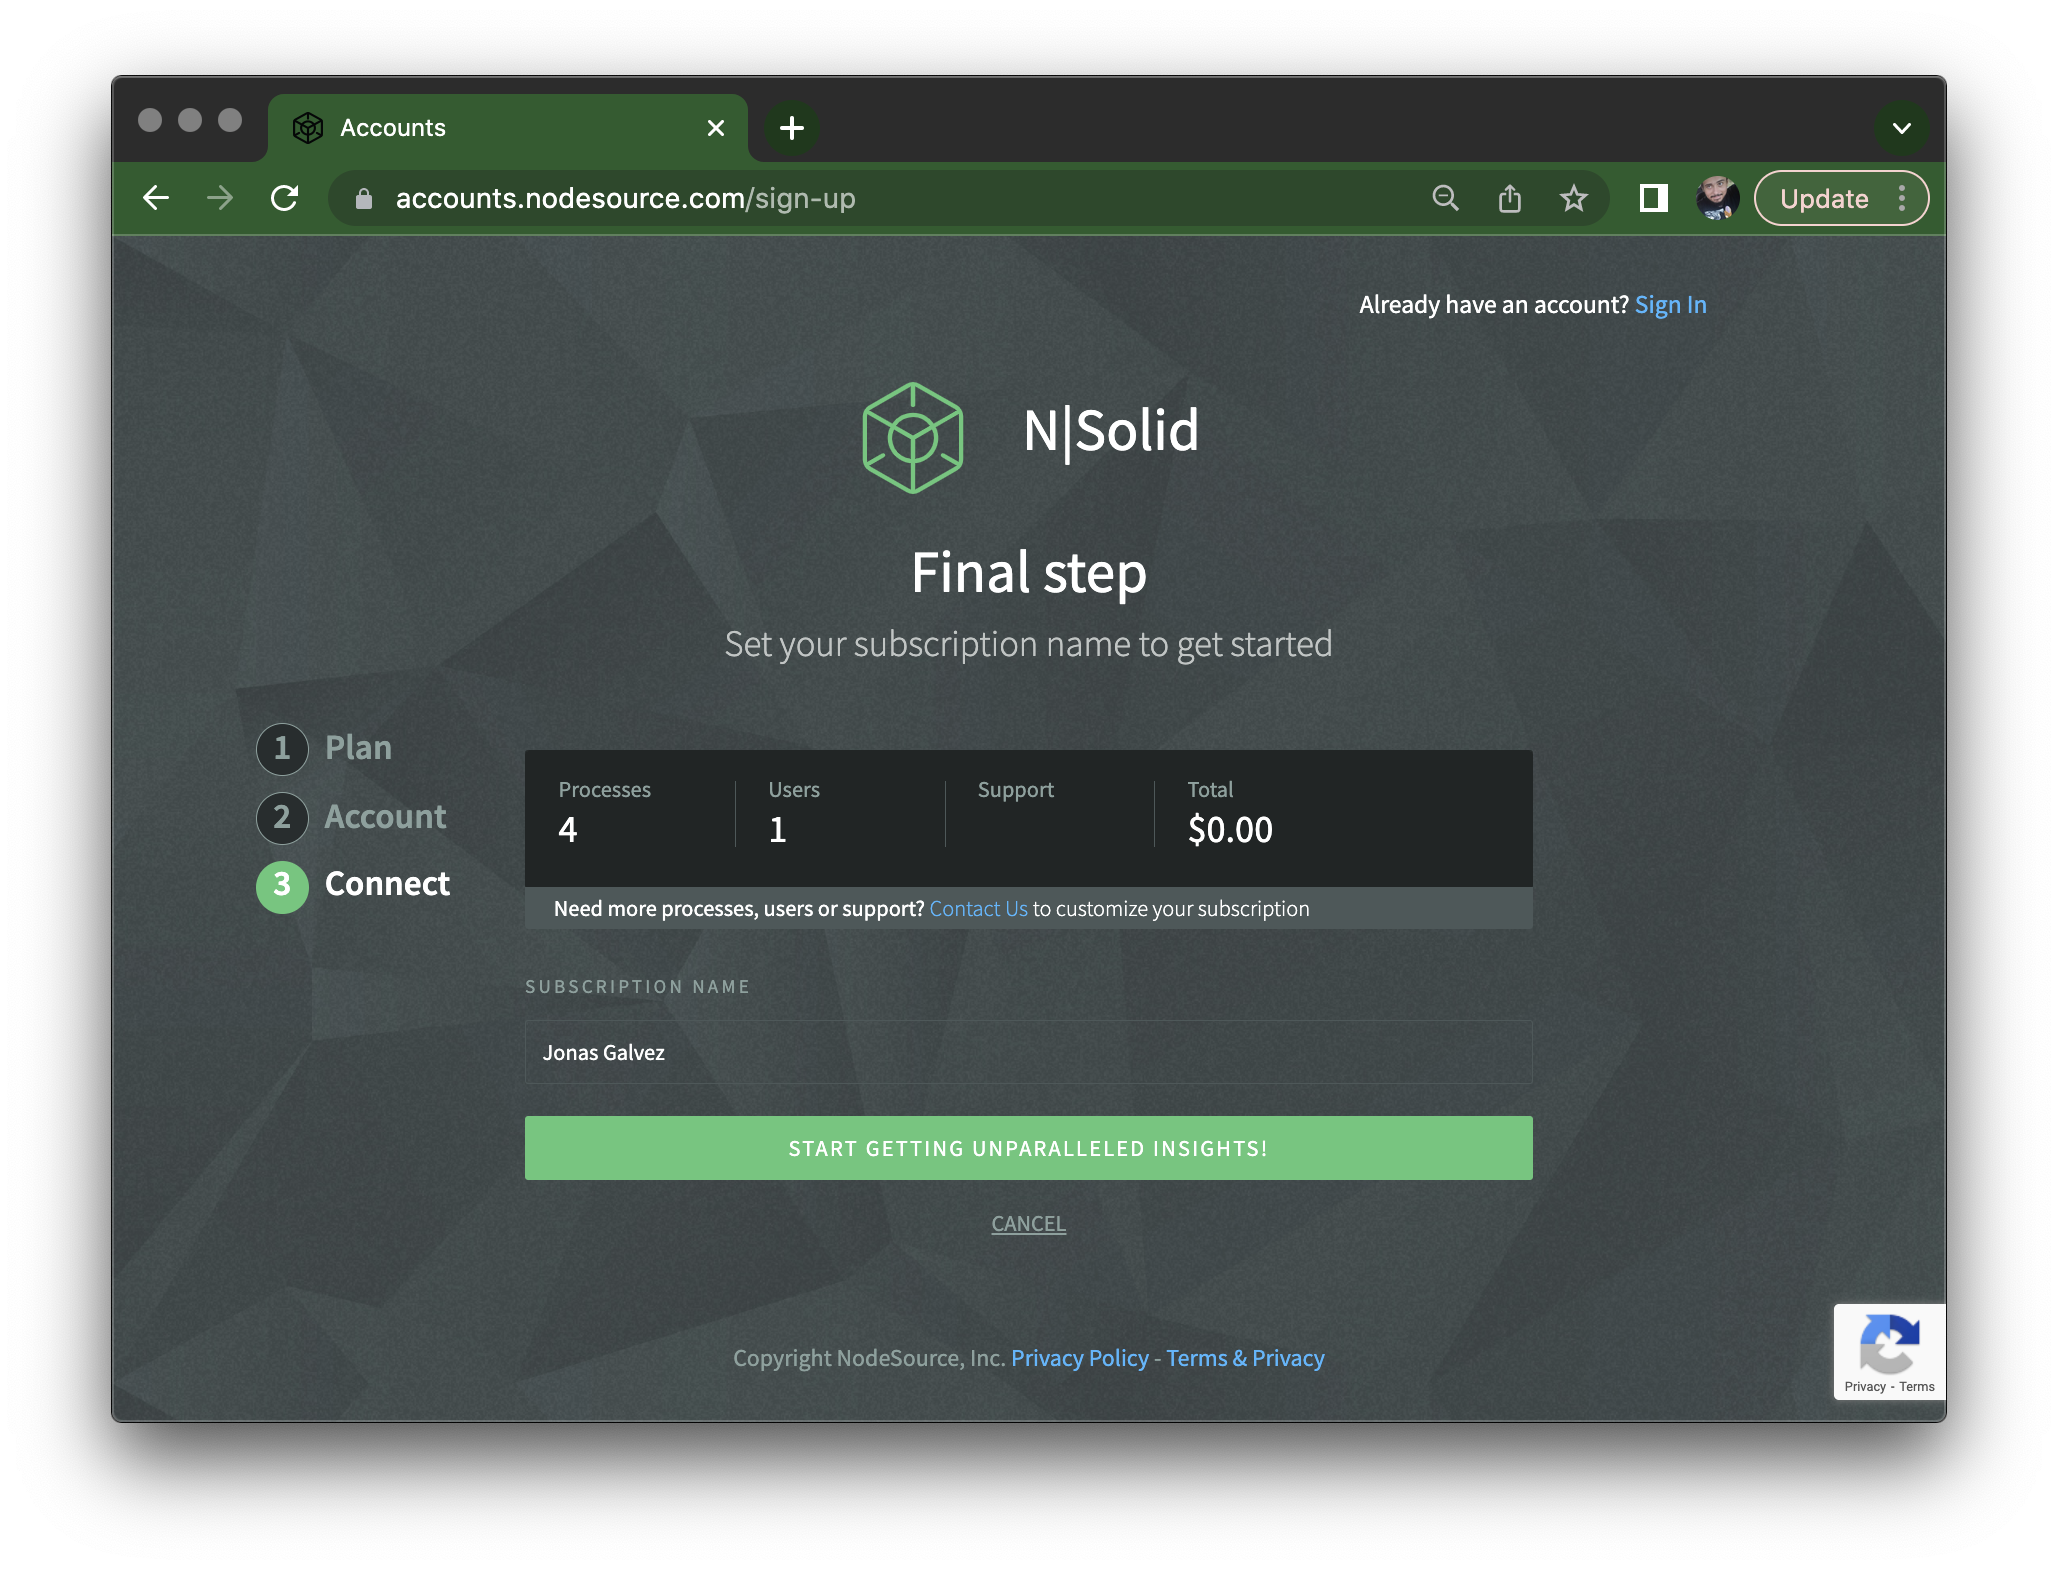
And this dashboard page which gives your N|Solid Console instance URL:
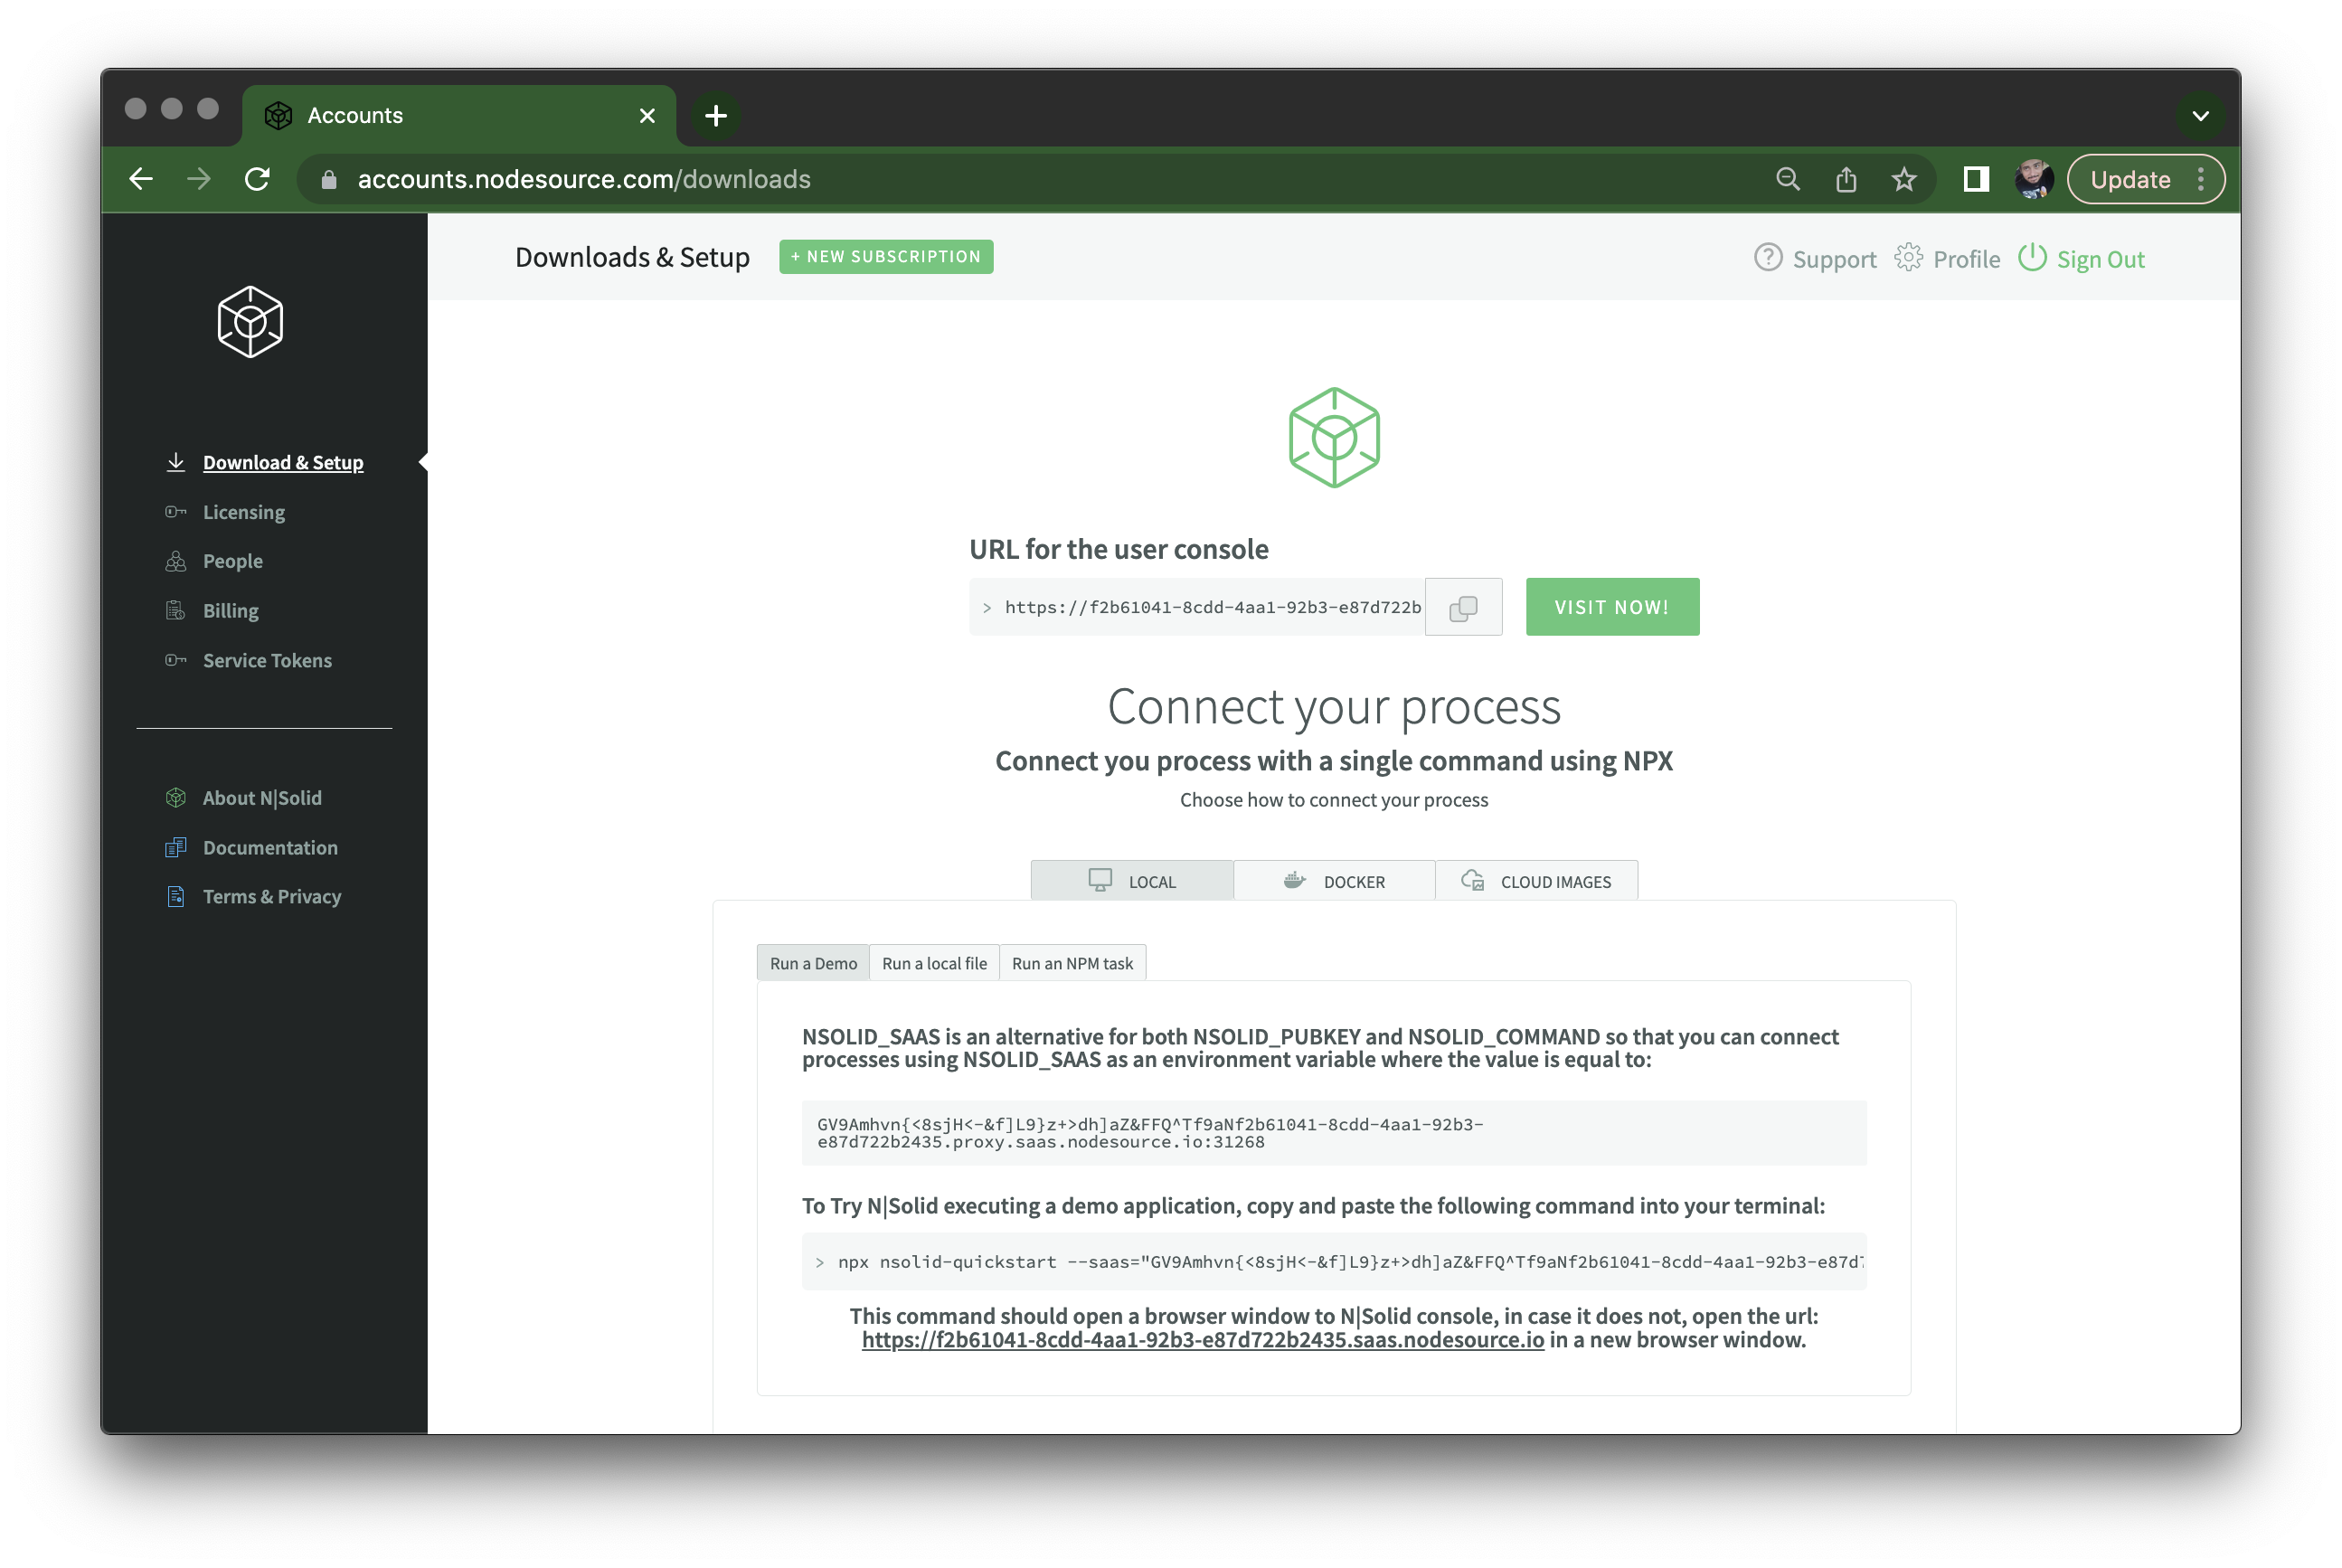
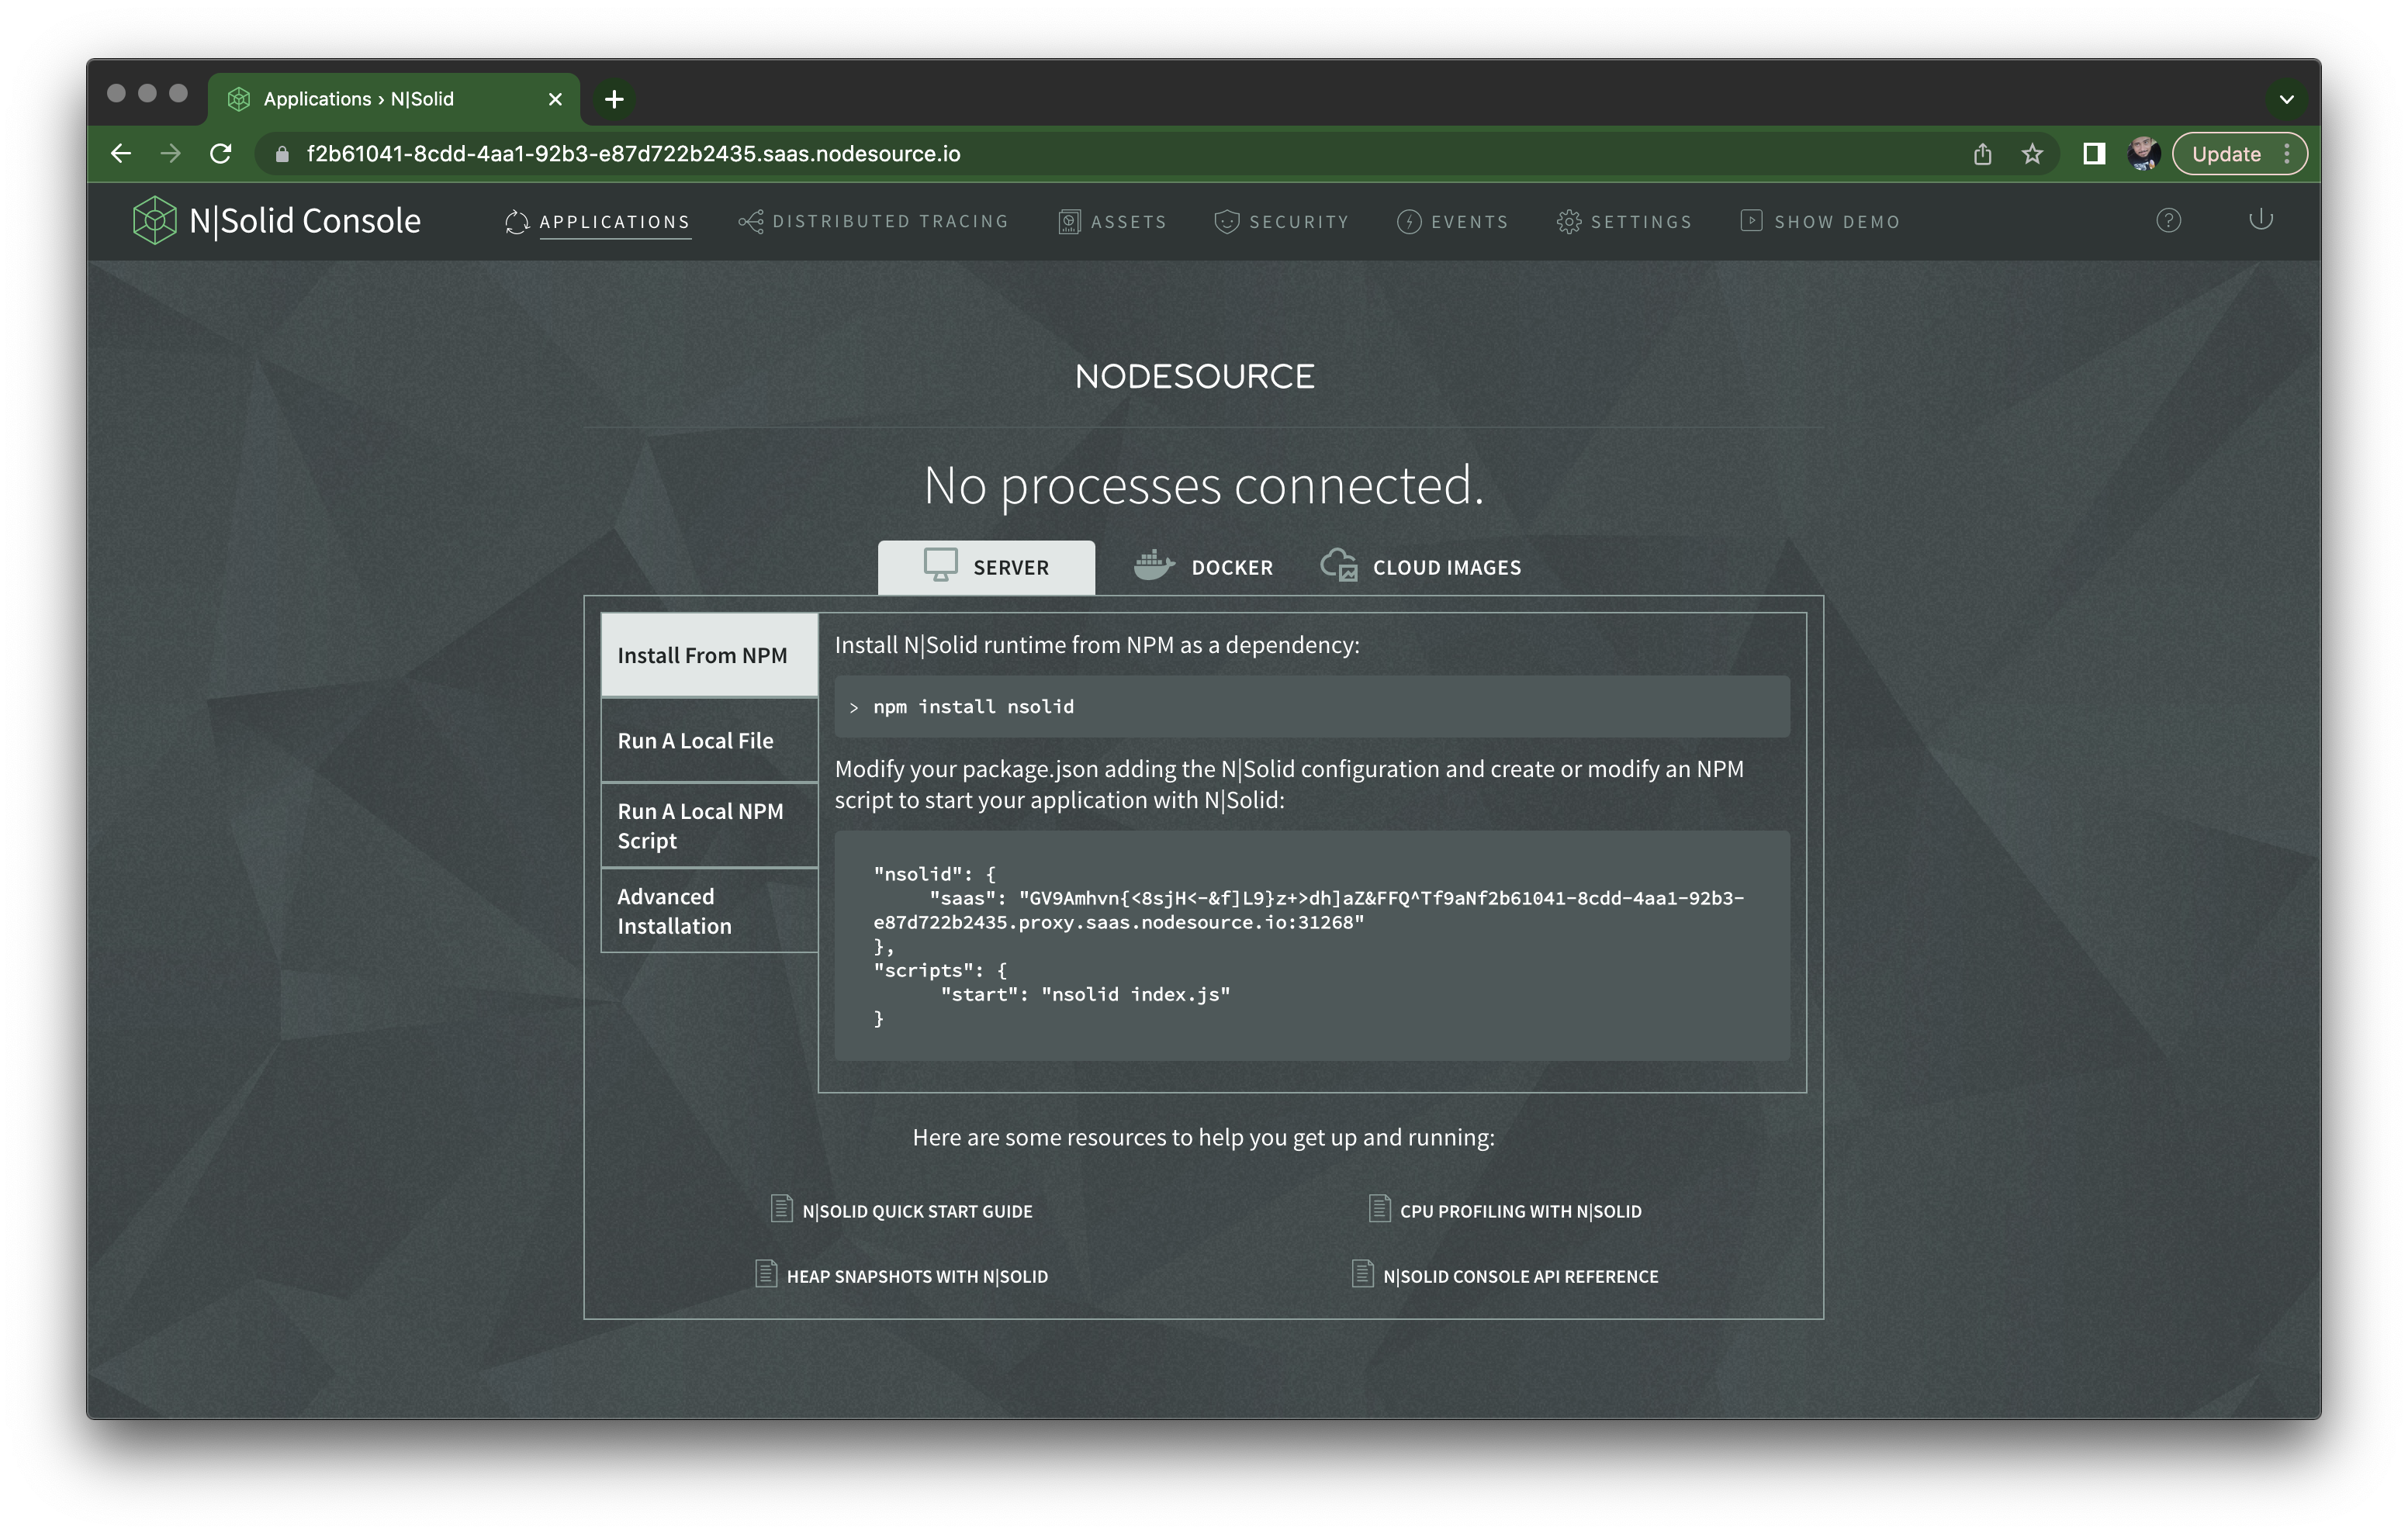
Once you visit it, you'll have to sign-in again using the same credentials you had for the sign-up, and then you see the actual N|Solid Console UI, showing no processes are connected, and instructions on how to connect:
Playing with N|Solid Console
Let's try monitoring the performance of a simple Fastify server application. First I'll copy and paste the nsolid key from the package.json example in the previous screen, which contains the N|Solid SaaS token. I'll also make sure to add a name to the package, because N|Solid Console uses it to group your applications:
{
  "name": "app",
  "nsolid": {
    "saas": "<token>.proxy.saas.nodesource.io:<port>"
  },
  "dependencies": {
    "fastify": "^4.12.0"
  }
}
Note that the N|Solid SaaS token might change if you spend some time without logging into your N|Solid Console instance. This will no longer be the case in the future, but right now be mindful that you need to update this value in your
package.jsonbetween sessions.Alternatively, you can use the
NSOLID_SASSenvironment variable to set it.
Then let's create server.mjs (using native ESM, which N|Solid fully supports) and add a few endpoints — the index route will just serve a string, that's our baseline, and then an endpoint to use a lot of CPU and another to introduce a memory leak, adding strings to a global variable and never removing them:
import Fastify from 'fastify'
import { createHash } from 'node:crypto'

const server = Fastify()

server.get('/', (req, reply) => {
  reply.send('Hello N|Solid!')
})

server.get('/misbehave/cpu', (req, reply) => {
  for (let i = 0; i < 100_000; i++) {
    createHash('sha256').update('123').digest('hex')
  }
  reply.send('Generated 100 thousand hashes!')
})

const hashes = []

server.get('/misbehave/memory', (req, reply) => {
  for (let i = 0; i < 100_000; i++) {
    hashes.push(createHash('sha256').update('123').digest('hex'))
  }
  reply.send('Generated and saved 100 thousand hashes!')
})

await server.listen({ port: 3000 })
Once you run it with nsolid index.mjs you should see it on your N|Solid Console, shown below. In this view, you'll see all applications connected to it, where each application is identified by the name field in your package.json files. Applications can have multiple individual nsolid instances connecting to it, but here you'll see CPU and Event Loop Utilization averages for all of them.
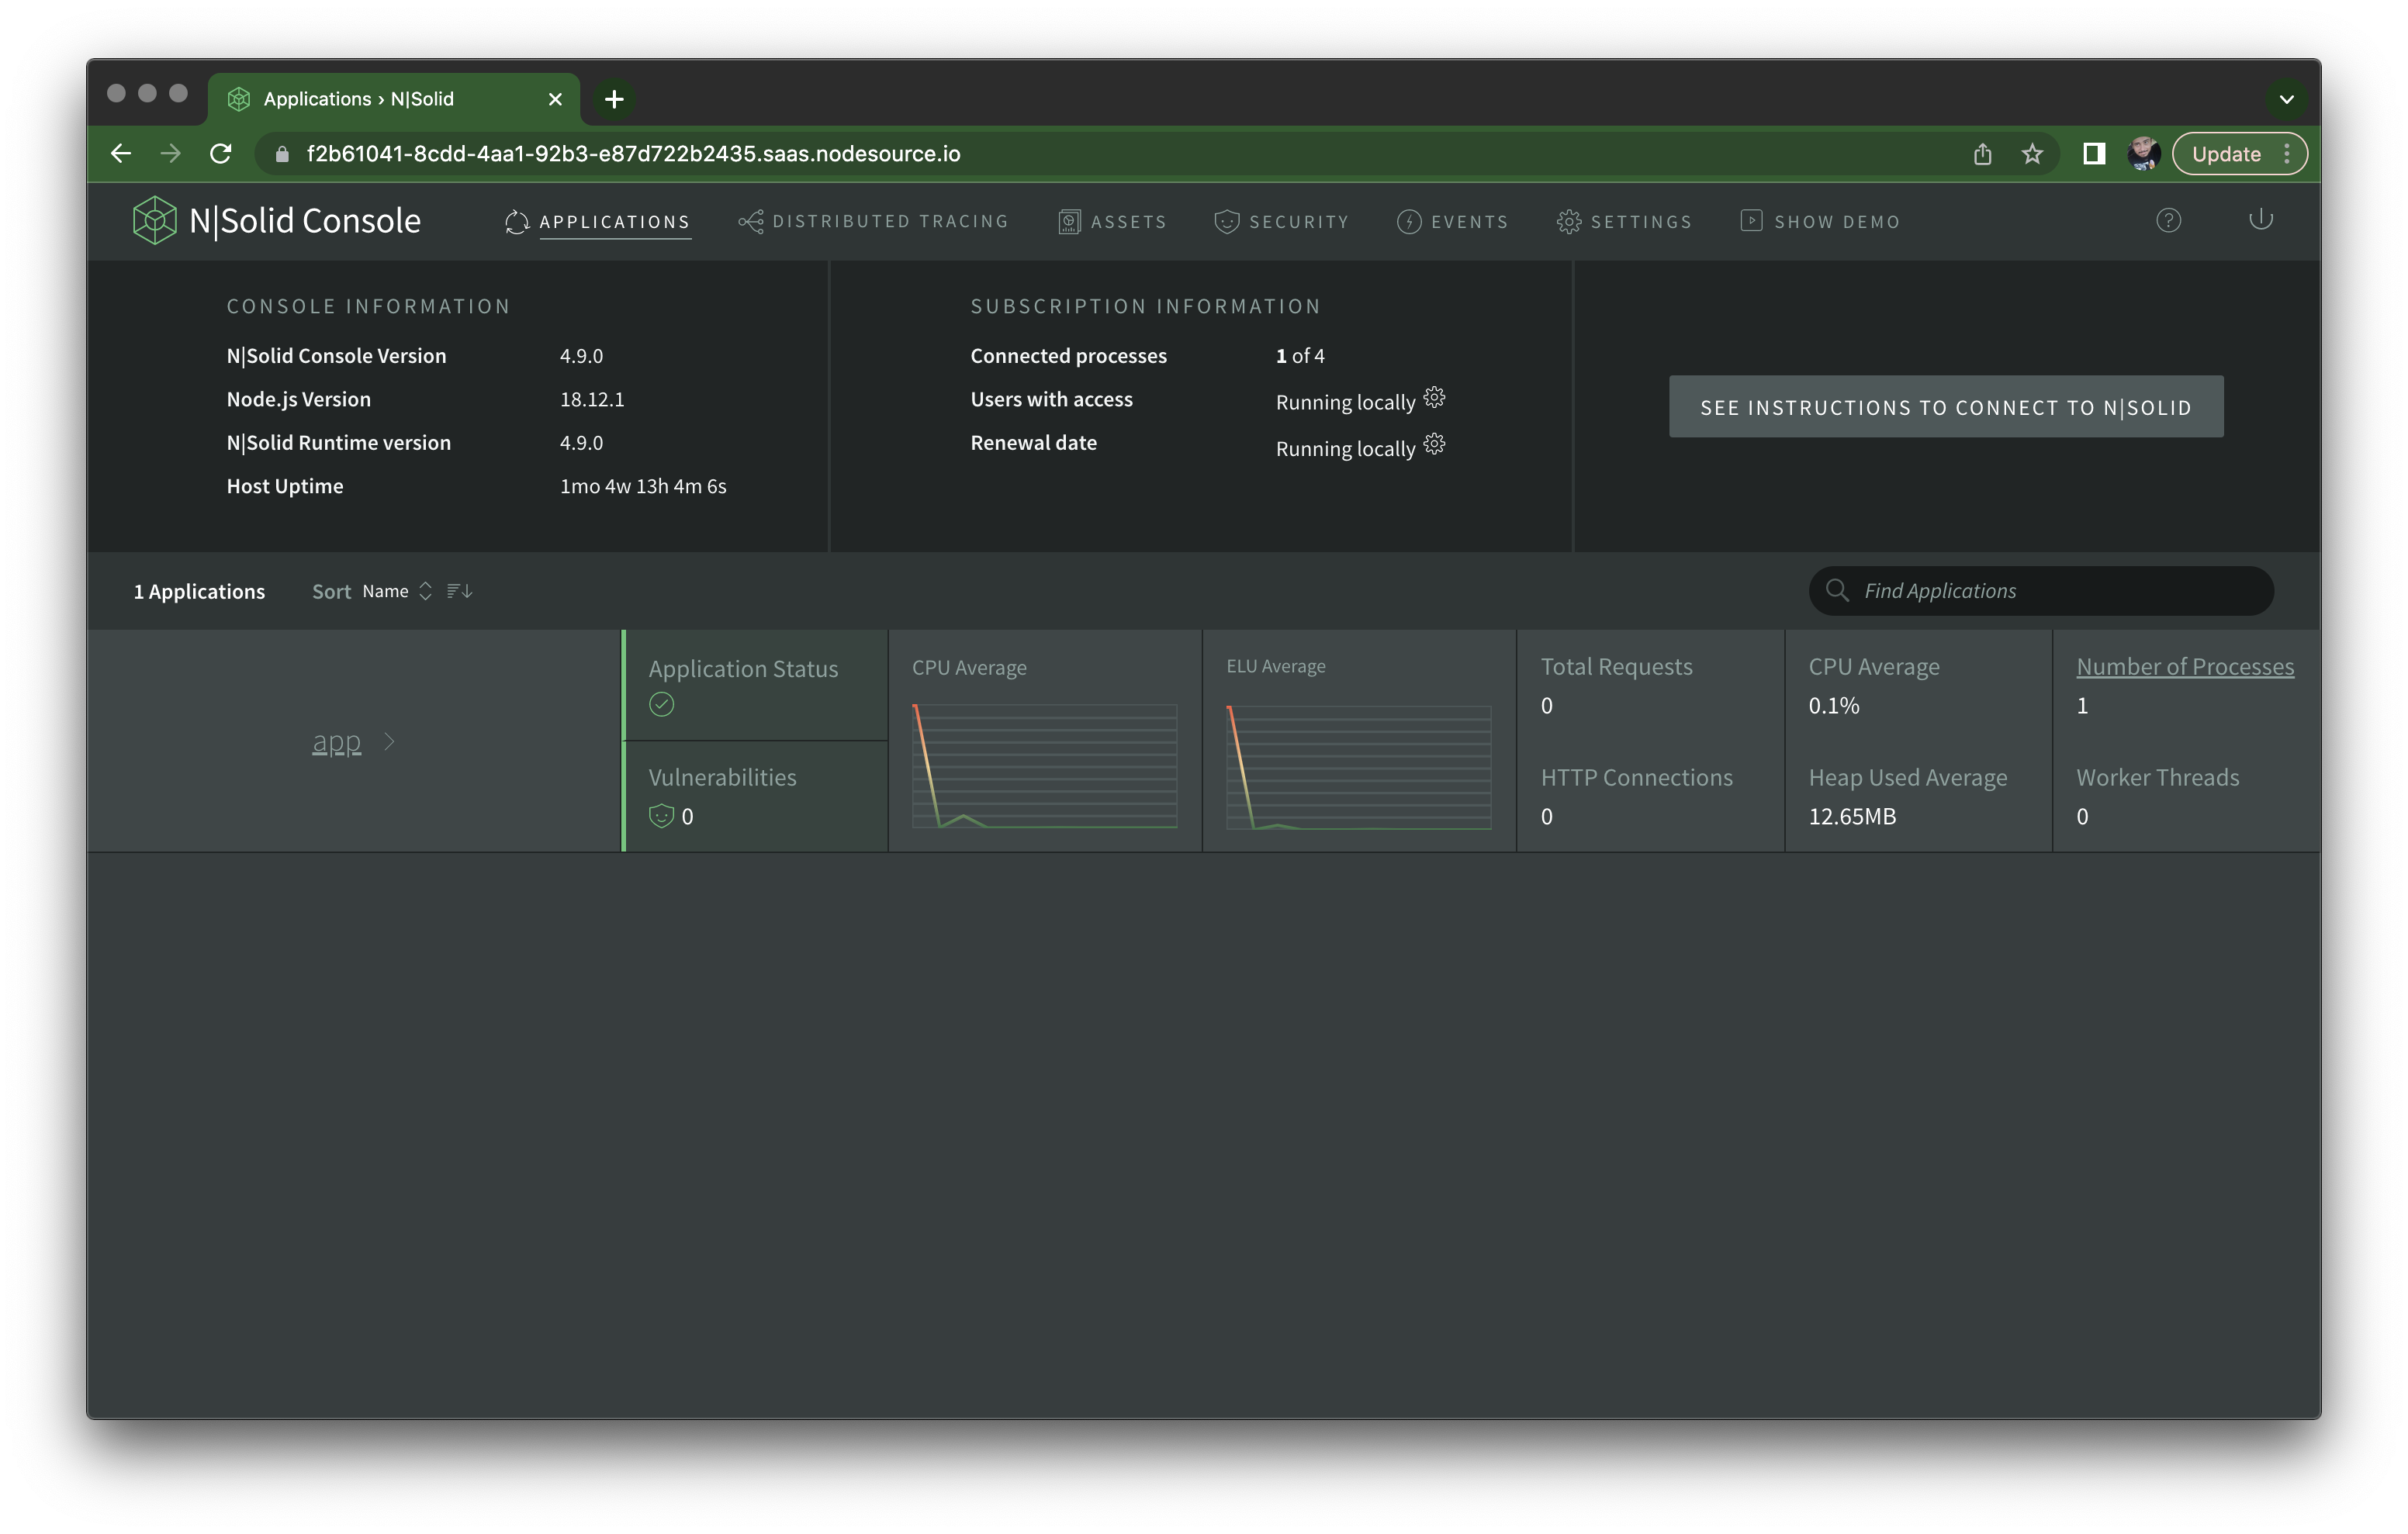
If you click Number of Processes on the far right of the application overview, it should take you to a scatter plot view of all processes, where the X axis and Y axis are the CPU and memory utilization, respectively. If you have only one nsolid instance running doing nothing, it should appear as a dot, and on the right column, you can click the individual process ID to see information about it.
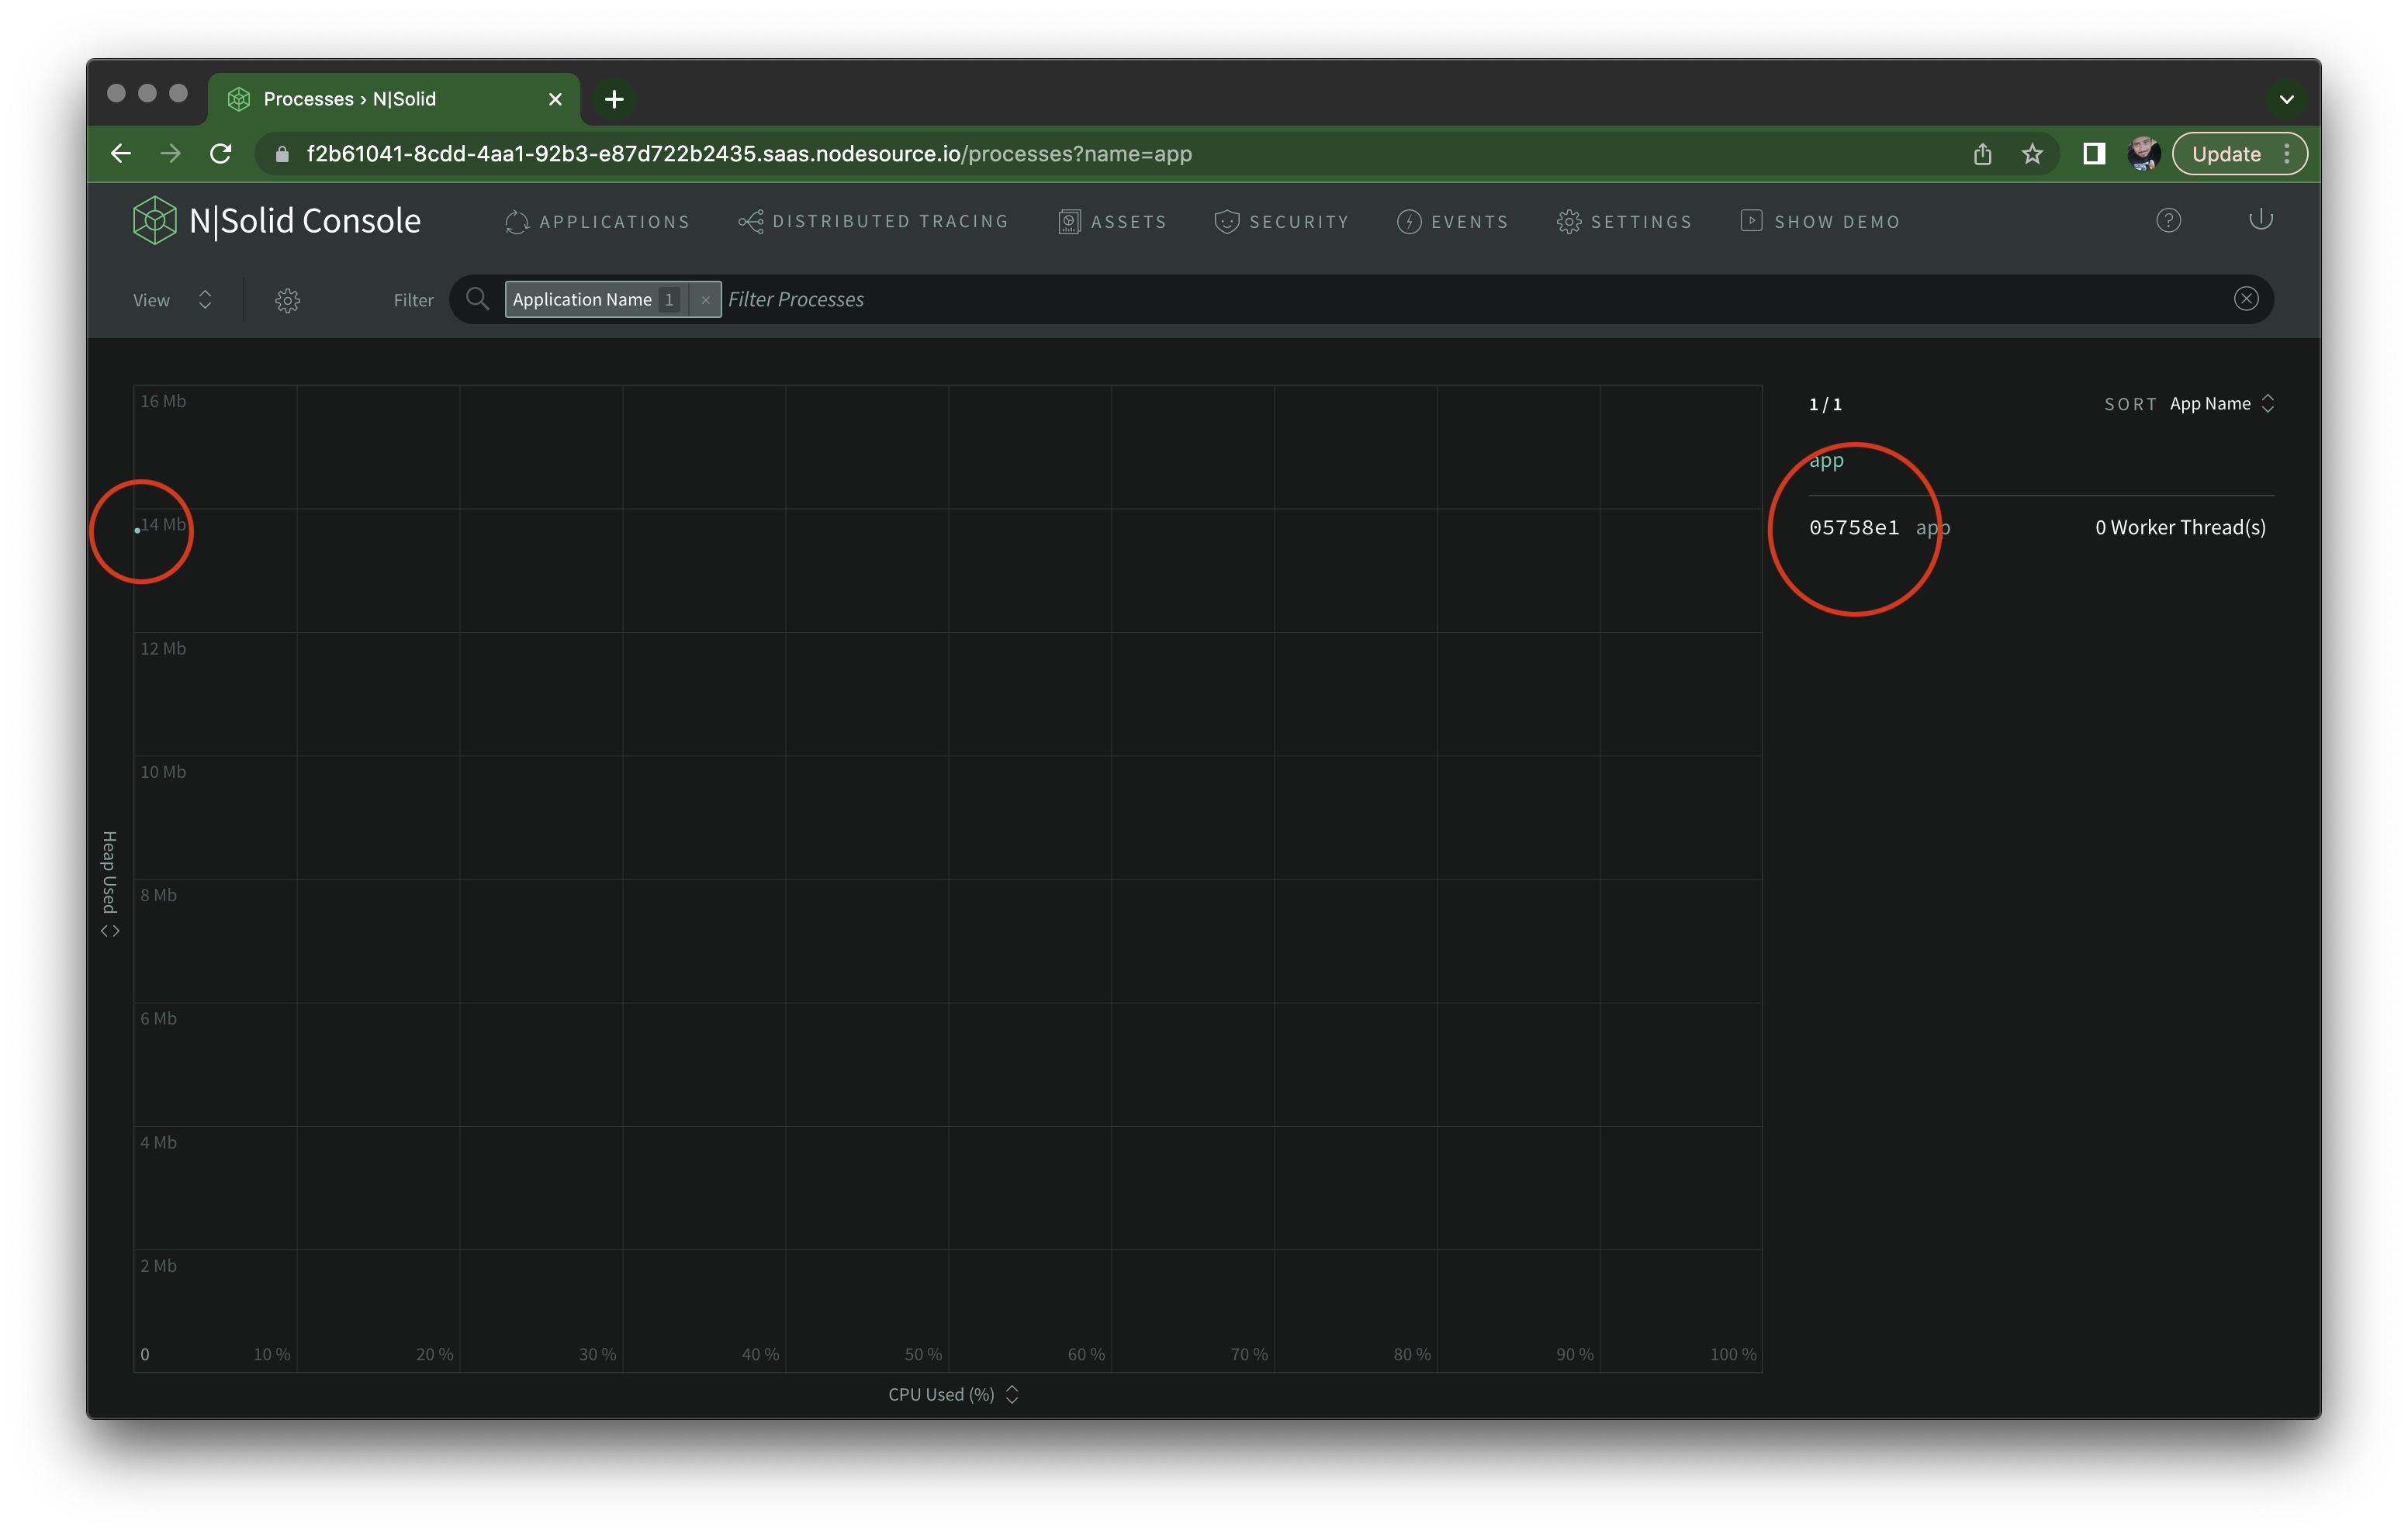
That's our little Fastify server, sitting there taking no traffic.
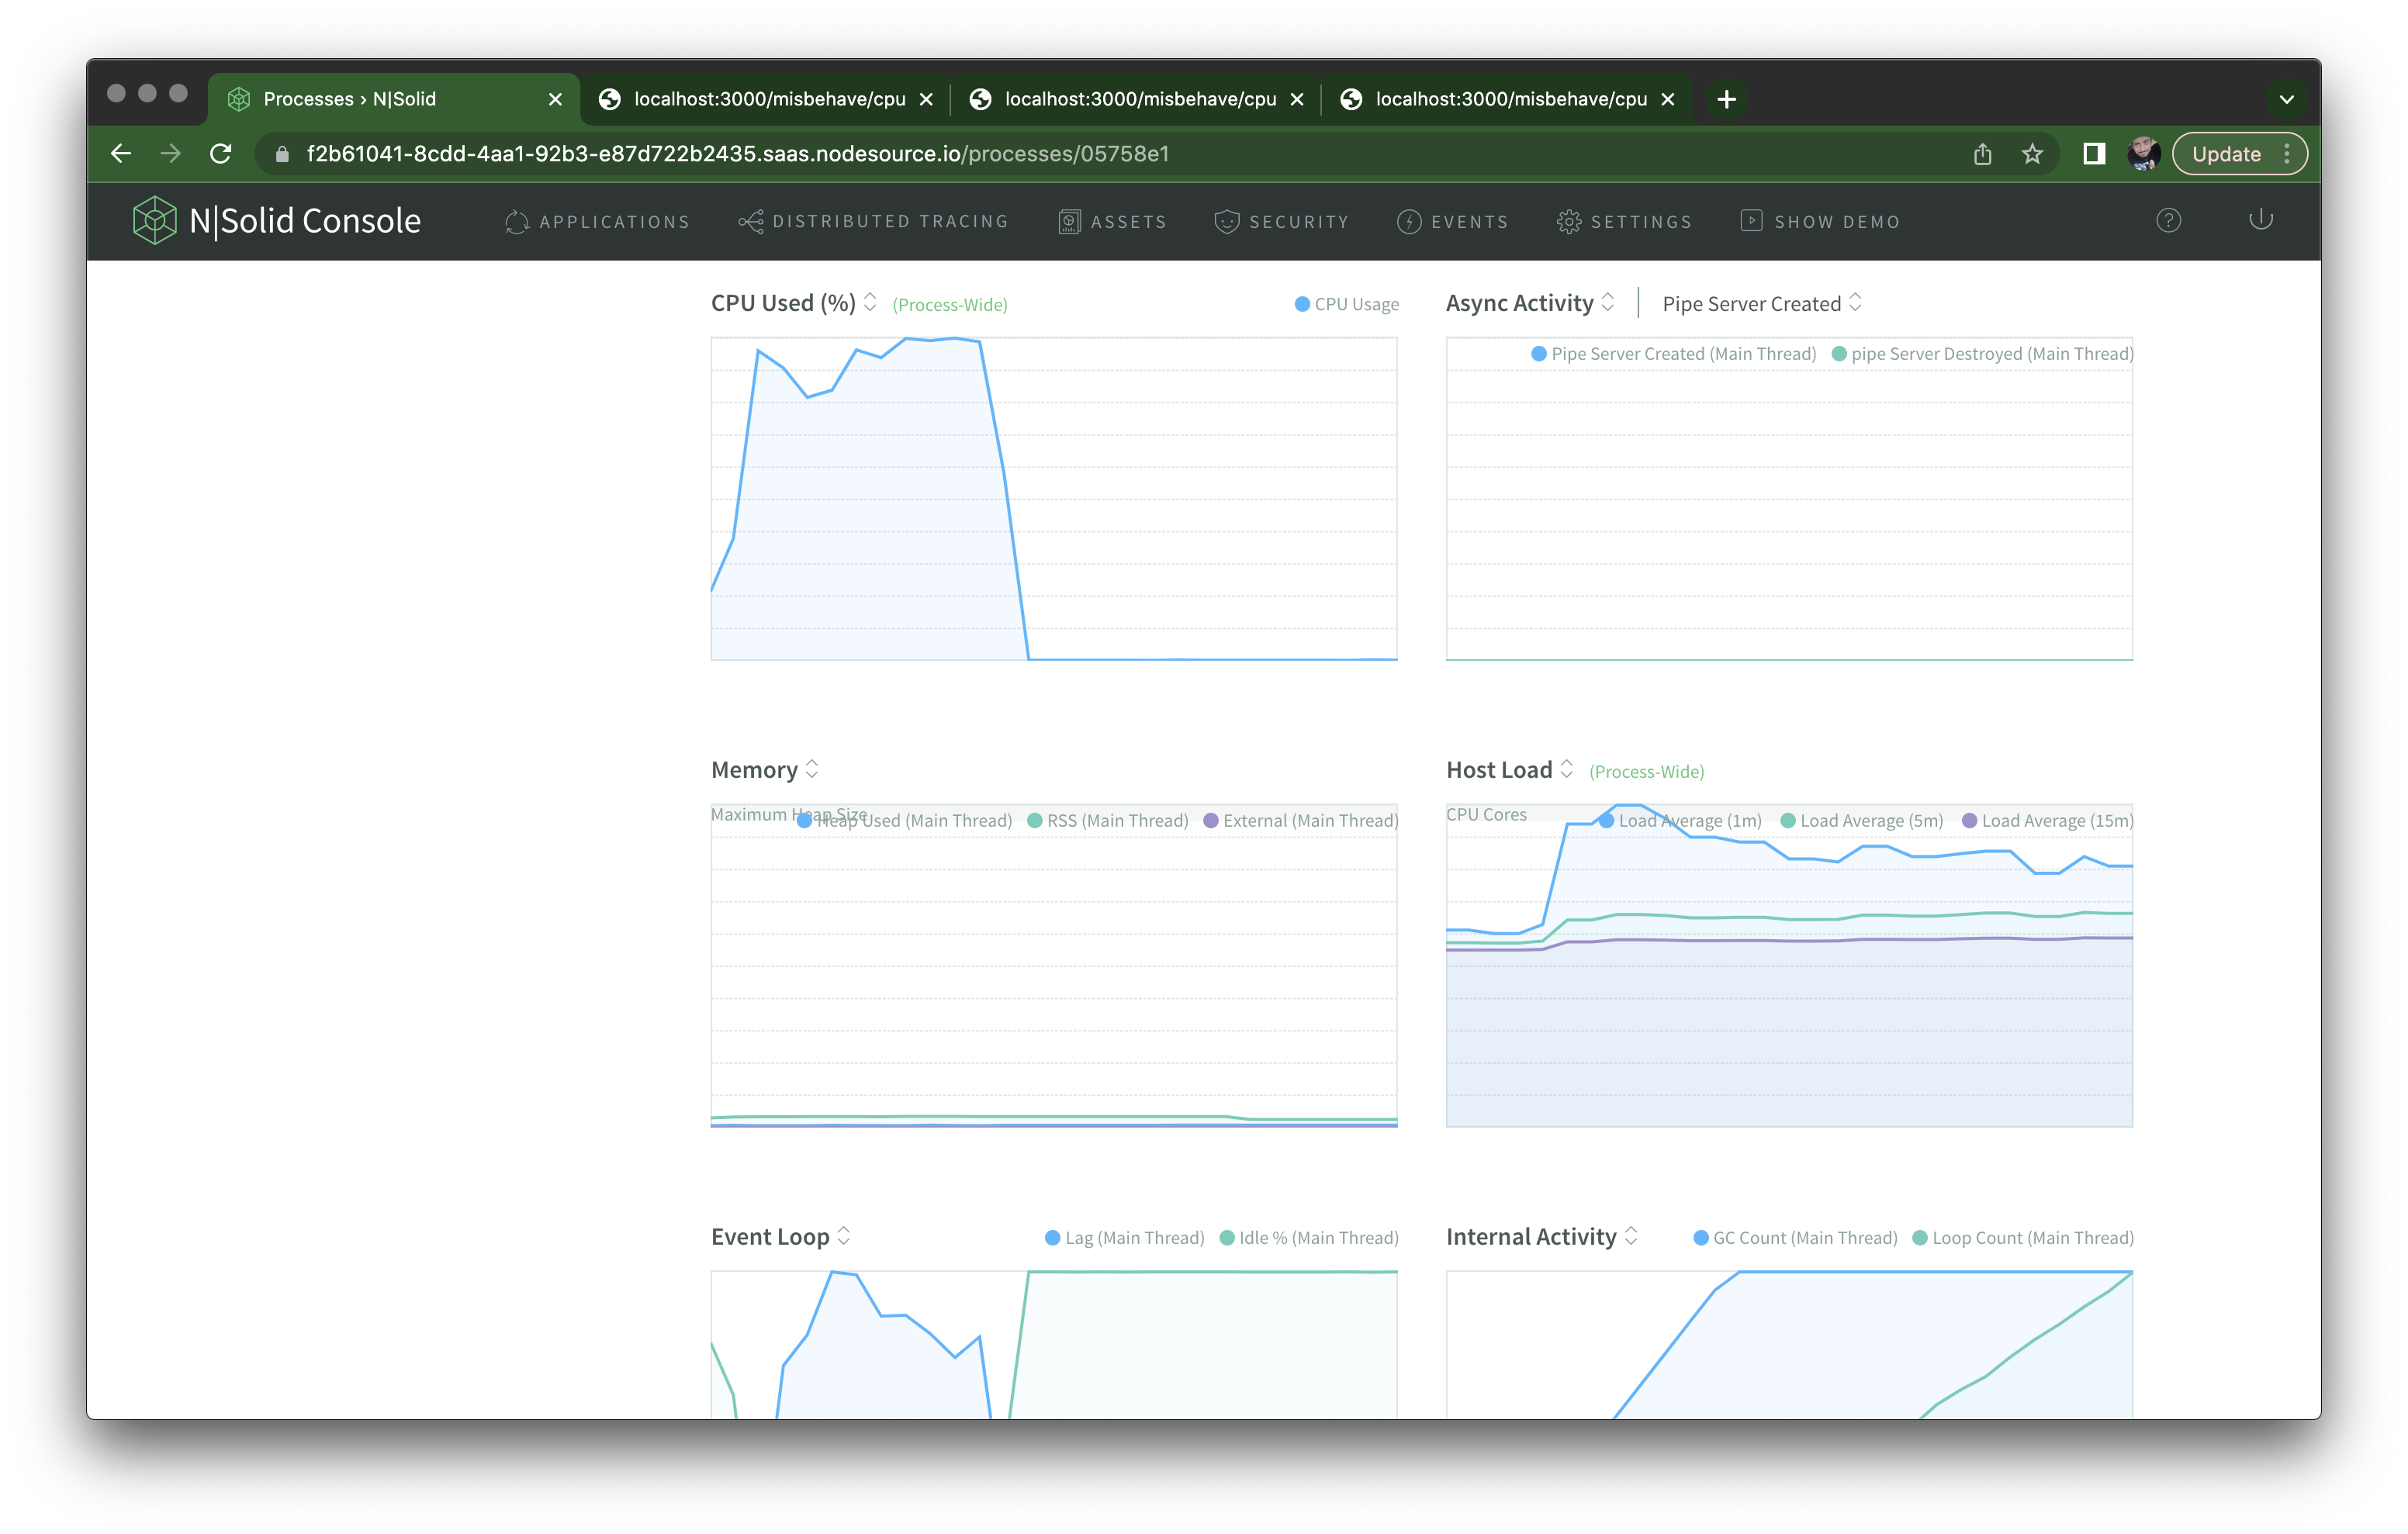
If I hit the /misbehave/cpu endpoint a few times though, I can see the CPU spike right away on the individual process view:
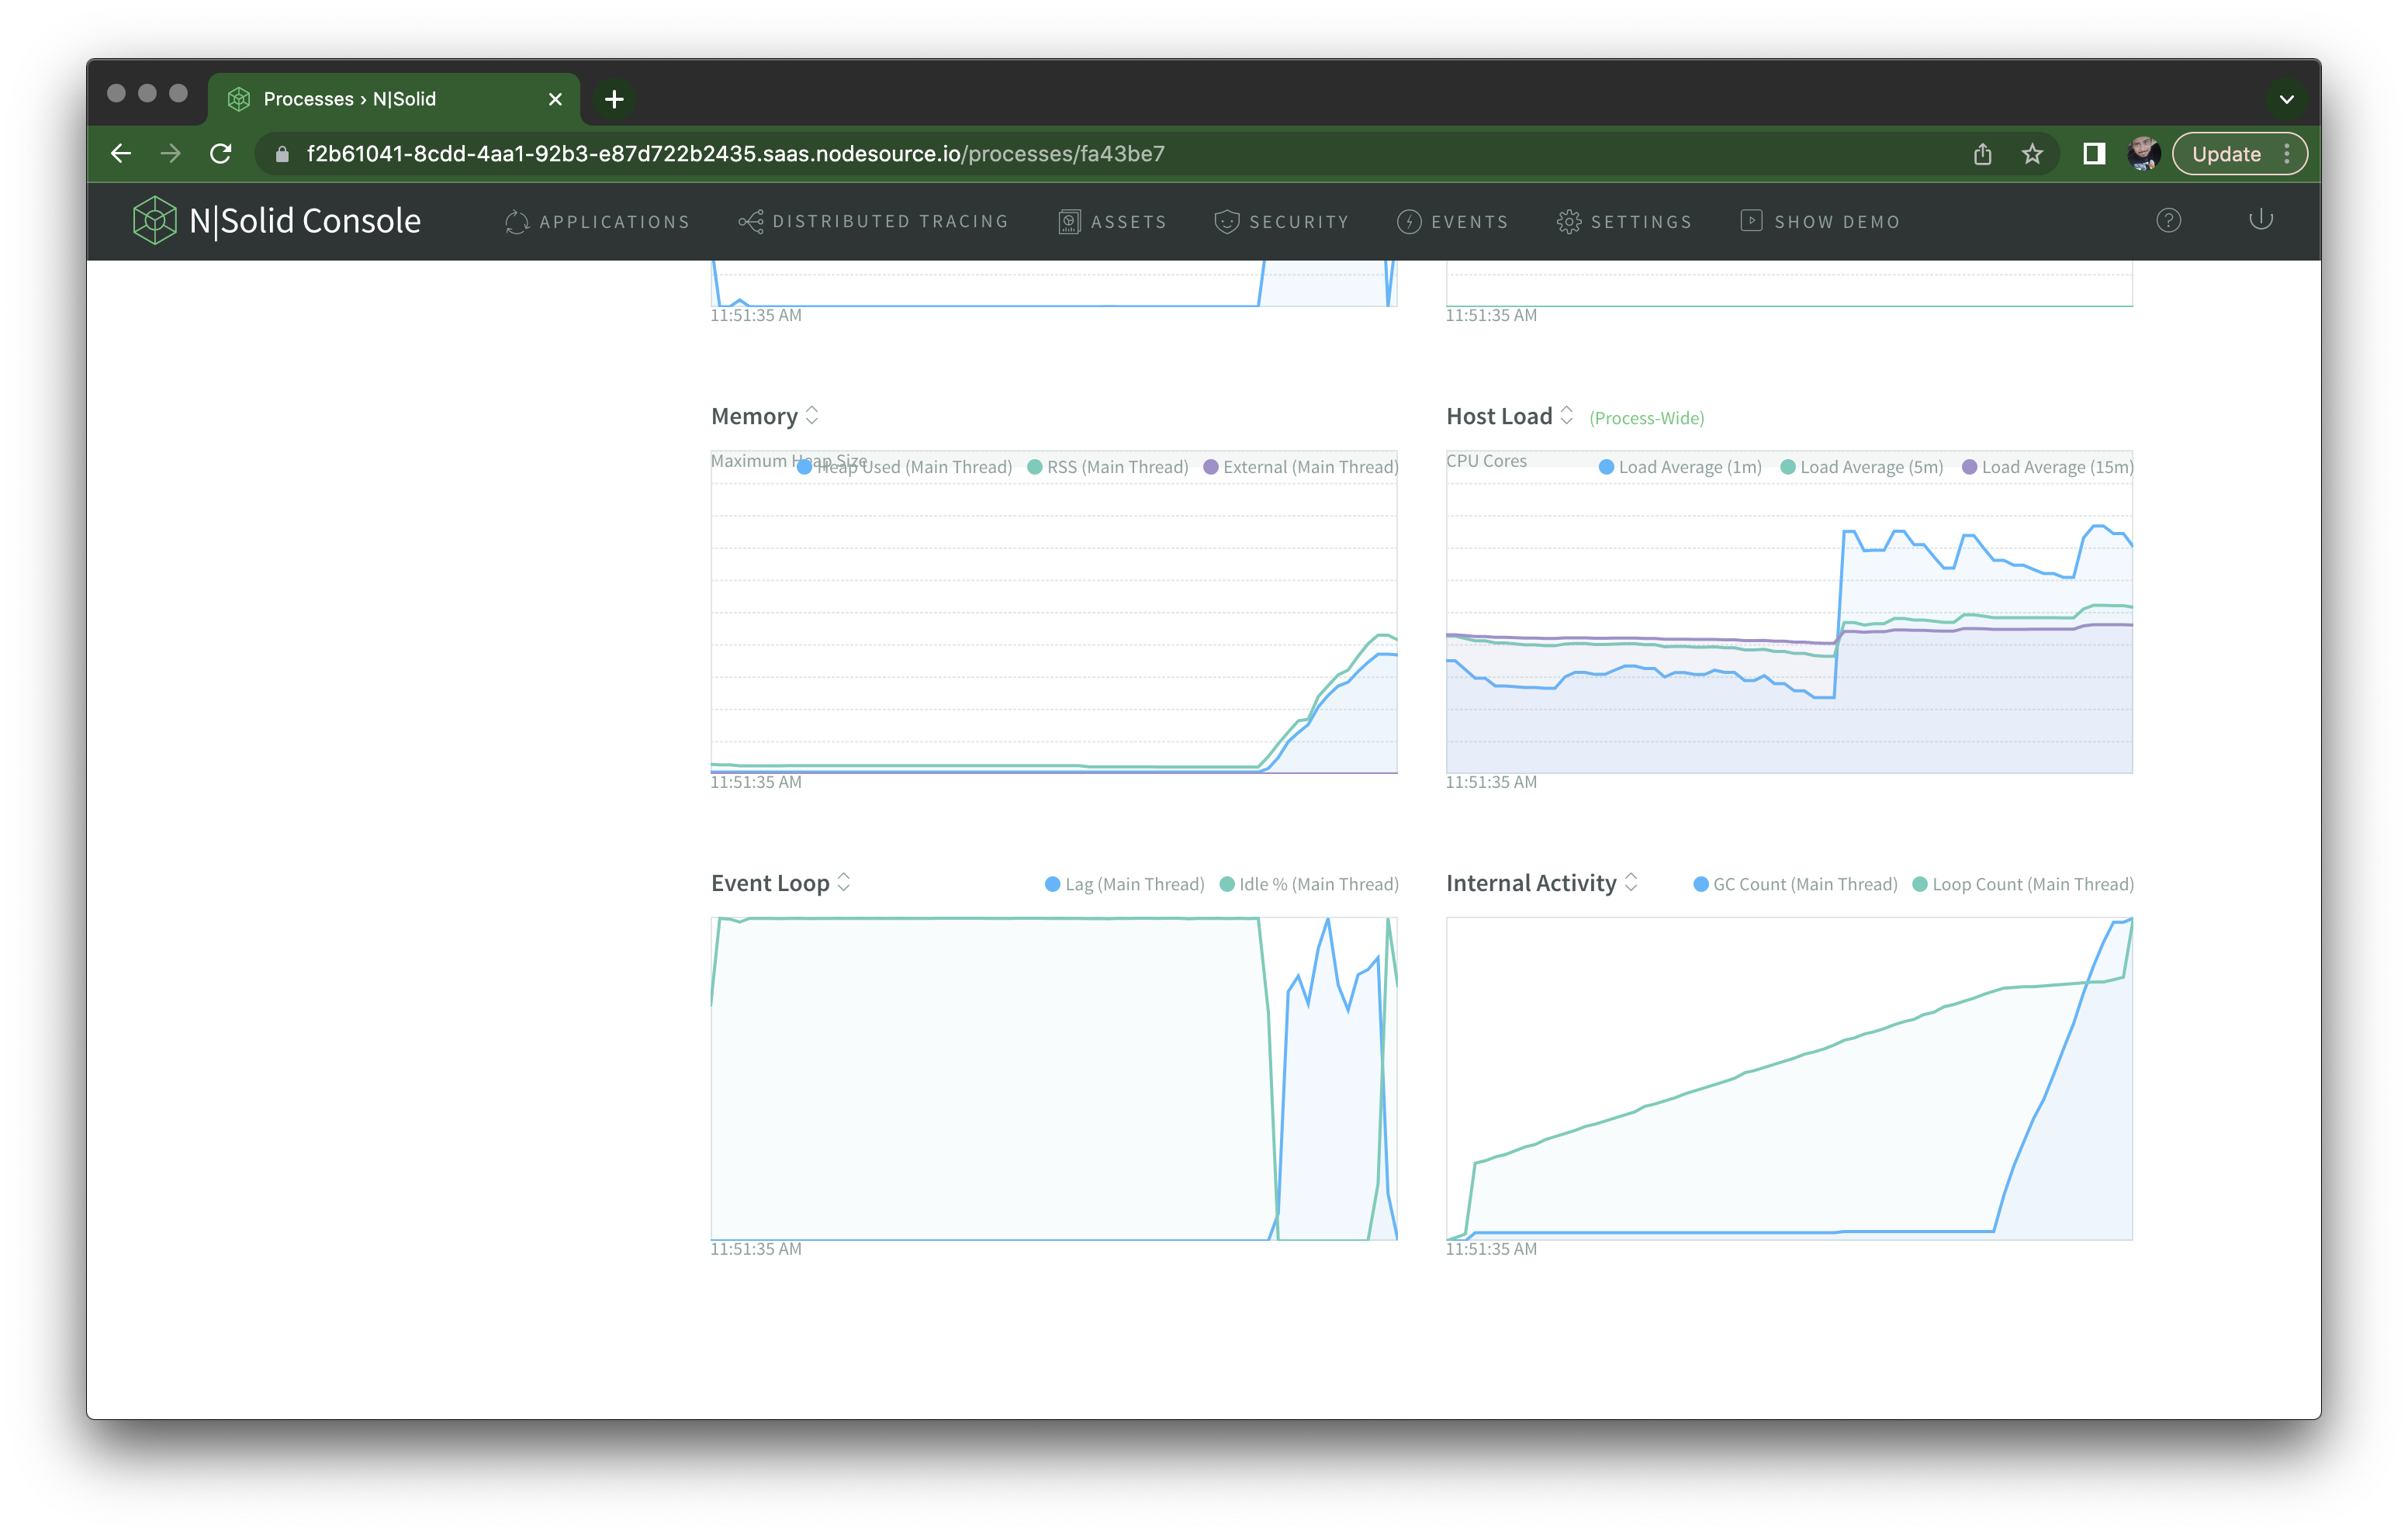
The same happens if I hit the /misbehave/memory endpoint with an autocannon run of 30 seconds — I can see memory usage growing uncontrolled and staying high:
So far, so good. You can use N|Solid Console to get a comprehensive metrics of multiple applications with multiple processes.
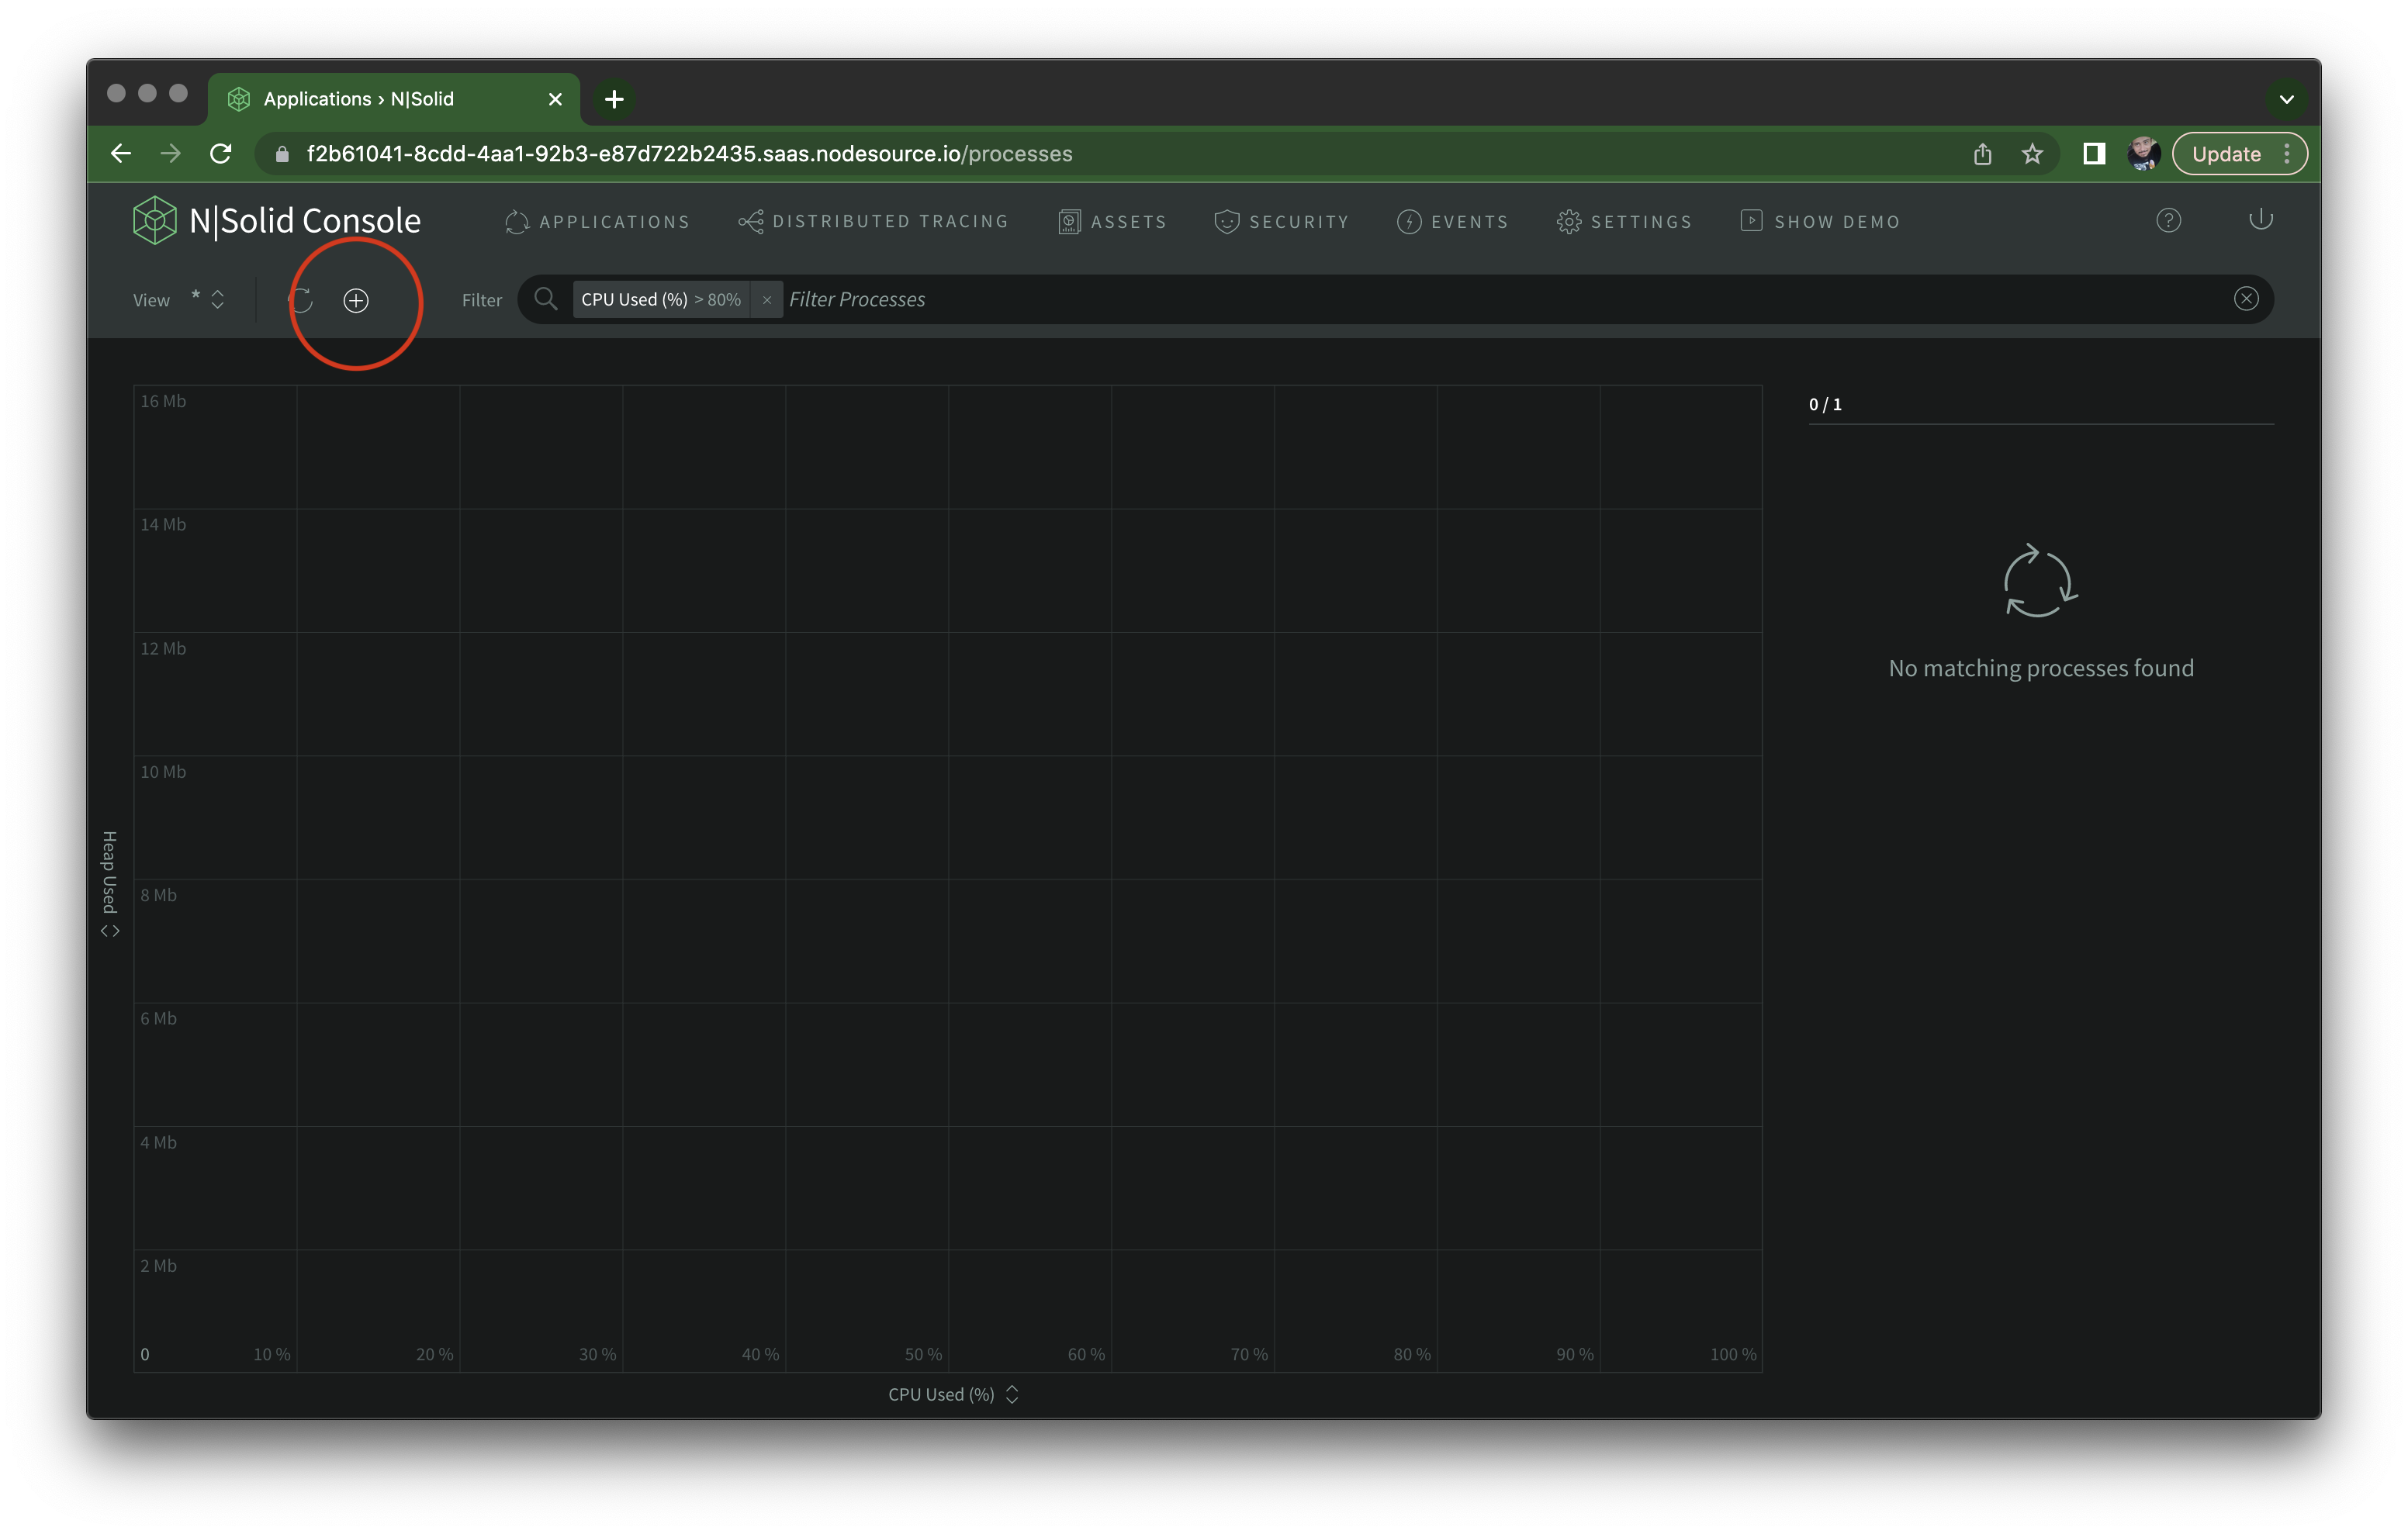
But there's a whole lot more you can do. If we go back to the scatter plot view, you'll notice a filtering input at the top. Let's say you want to have a filter to display all processes using over 80% CPU. Select the CPU Used filter from the dropdown:
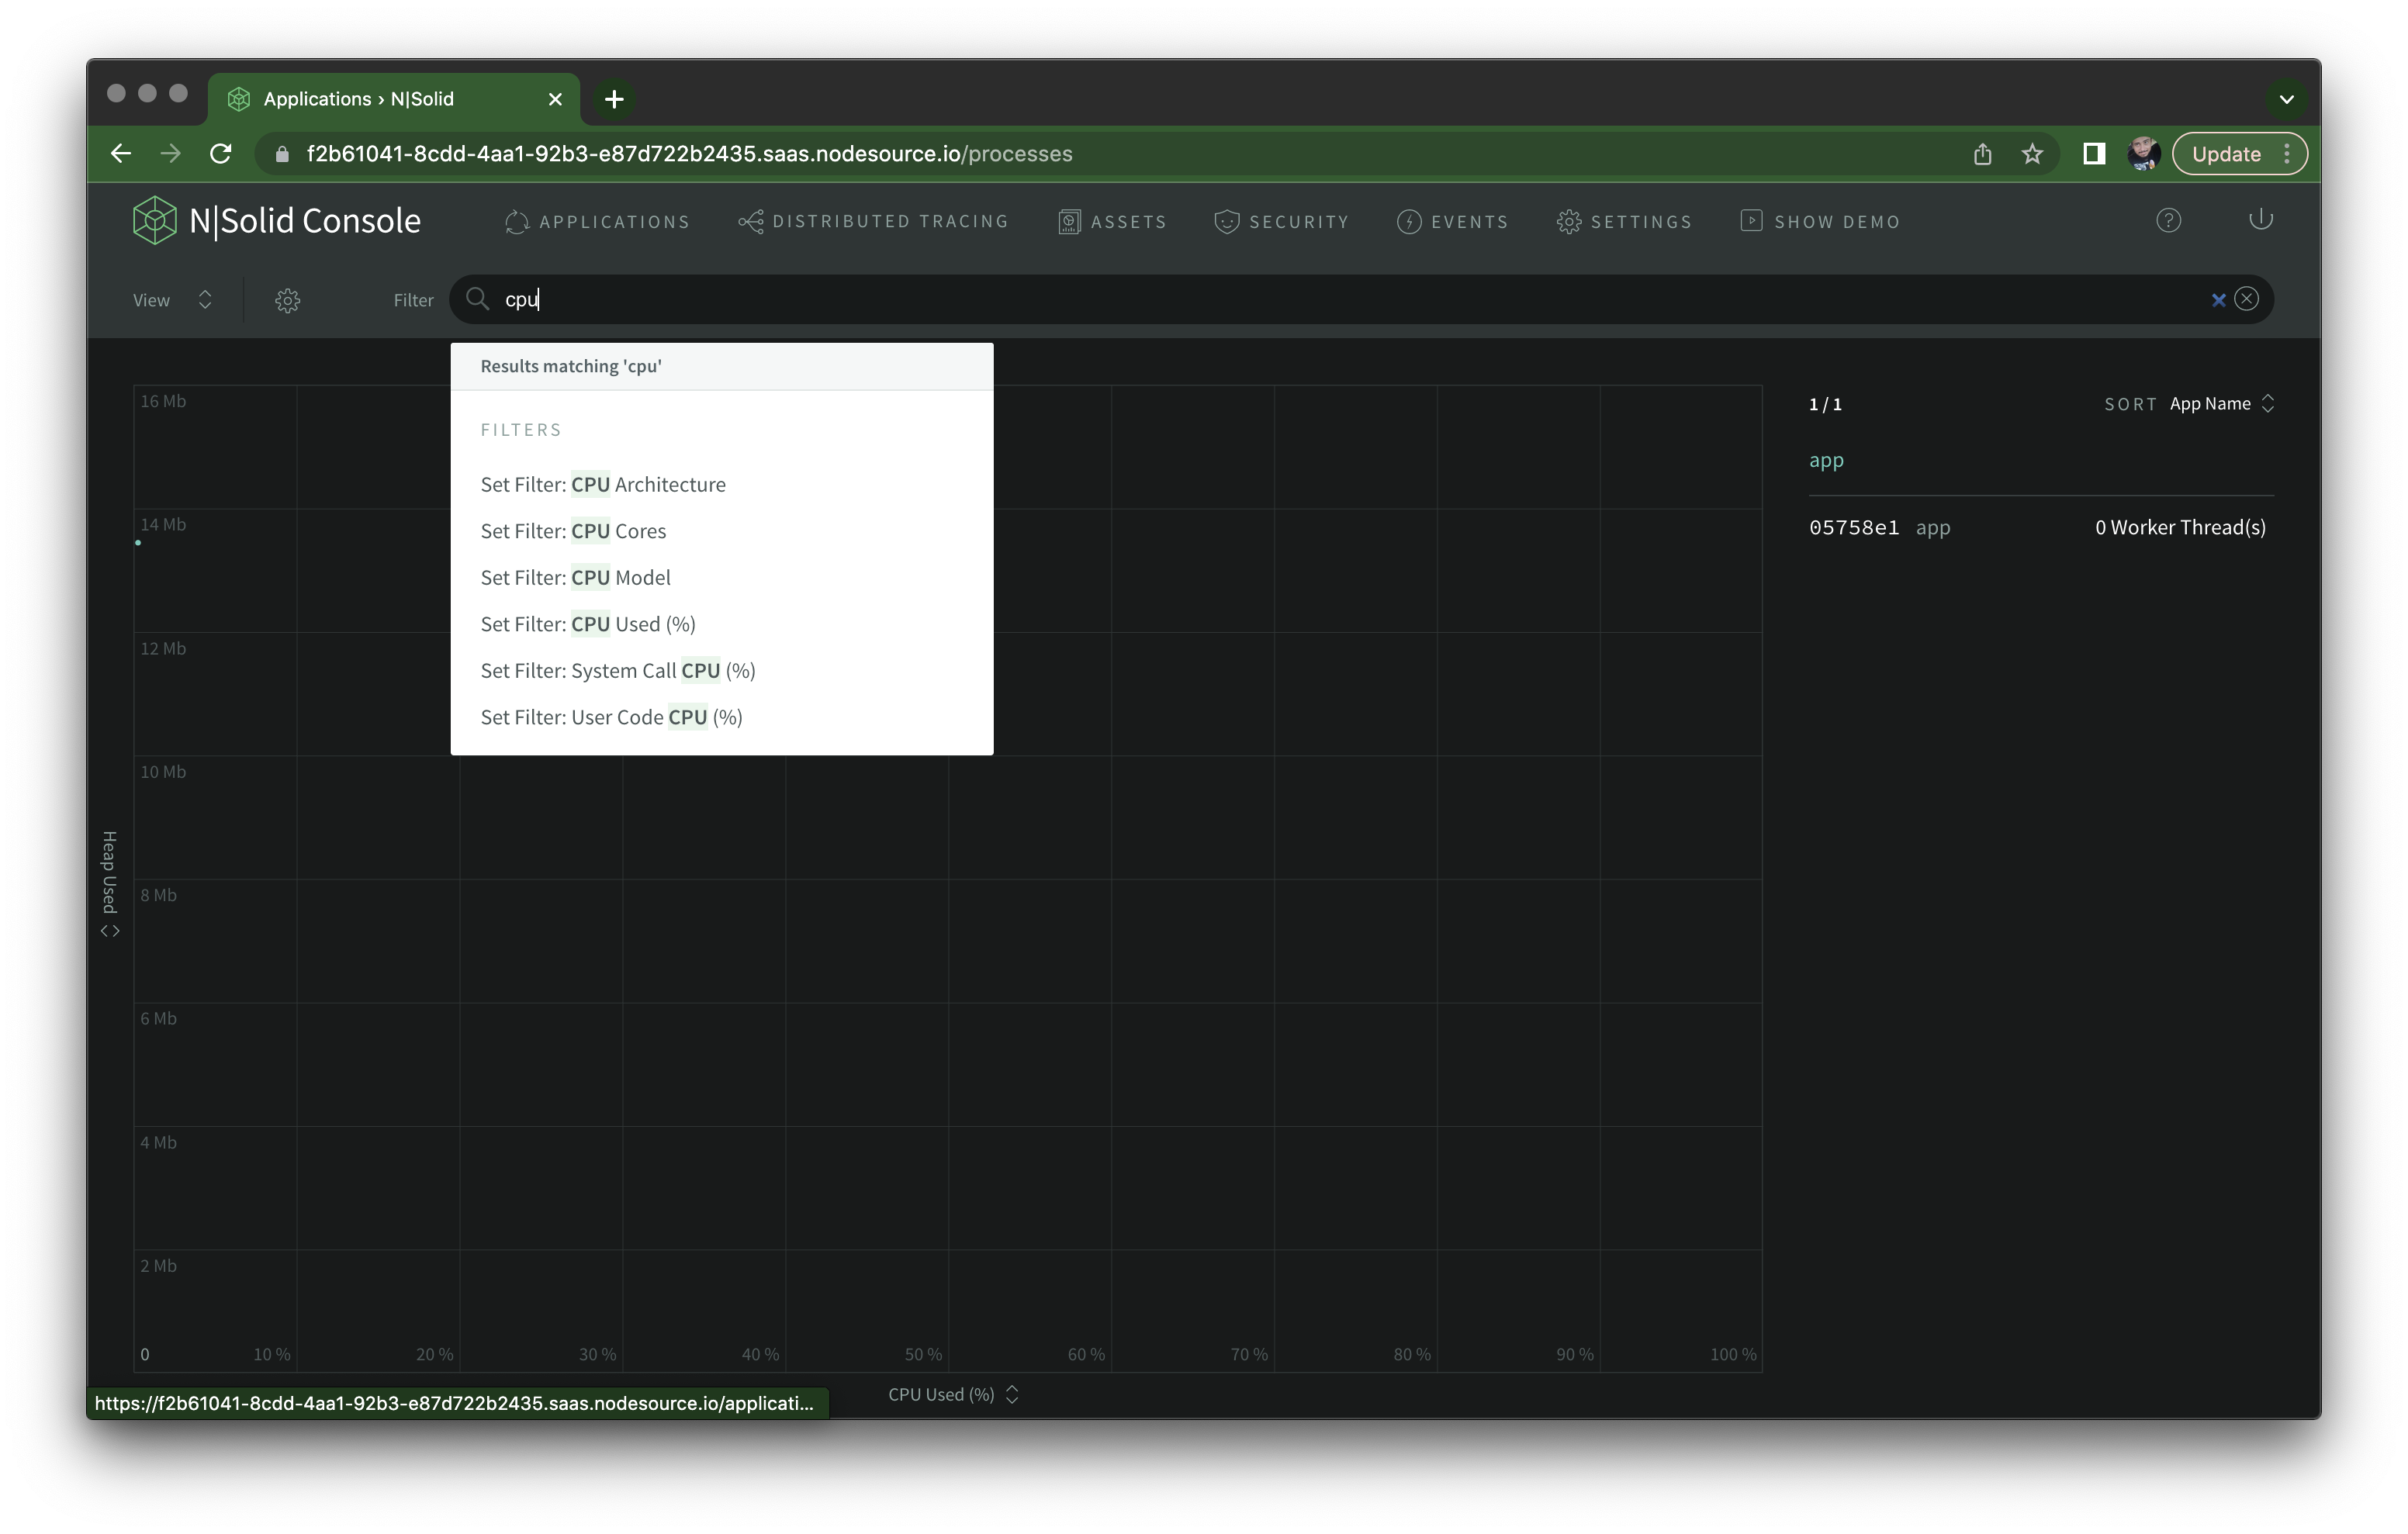
And after setting it to 80, click the + button to save the custom view:
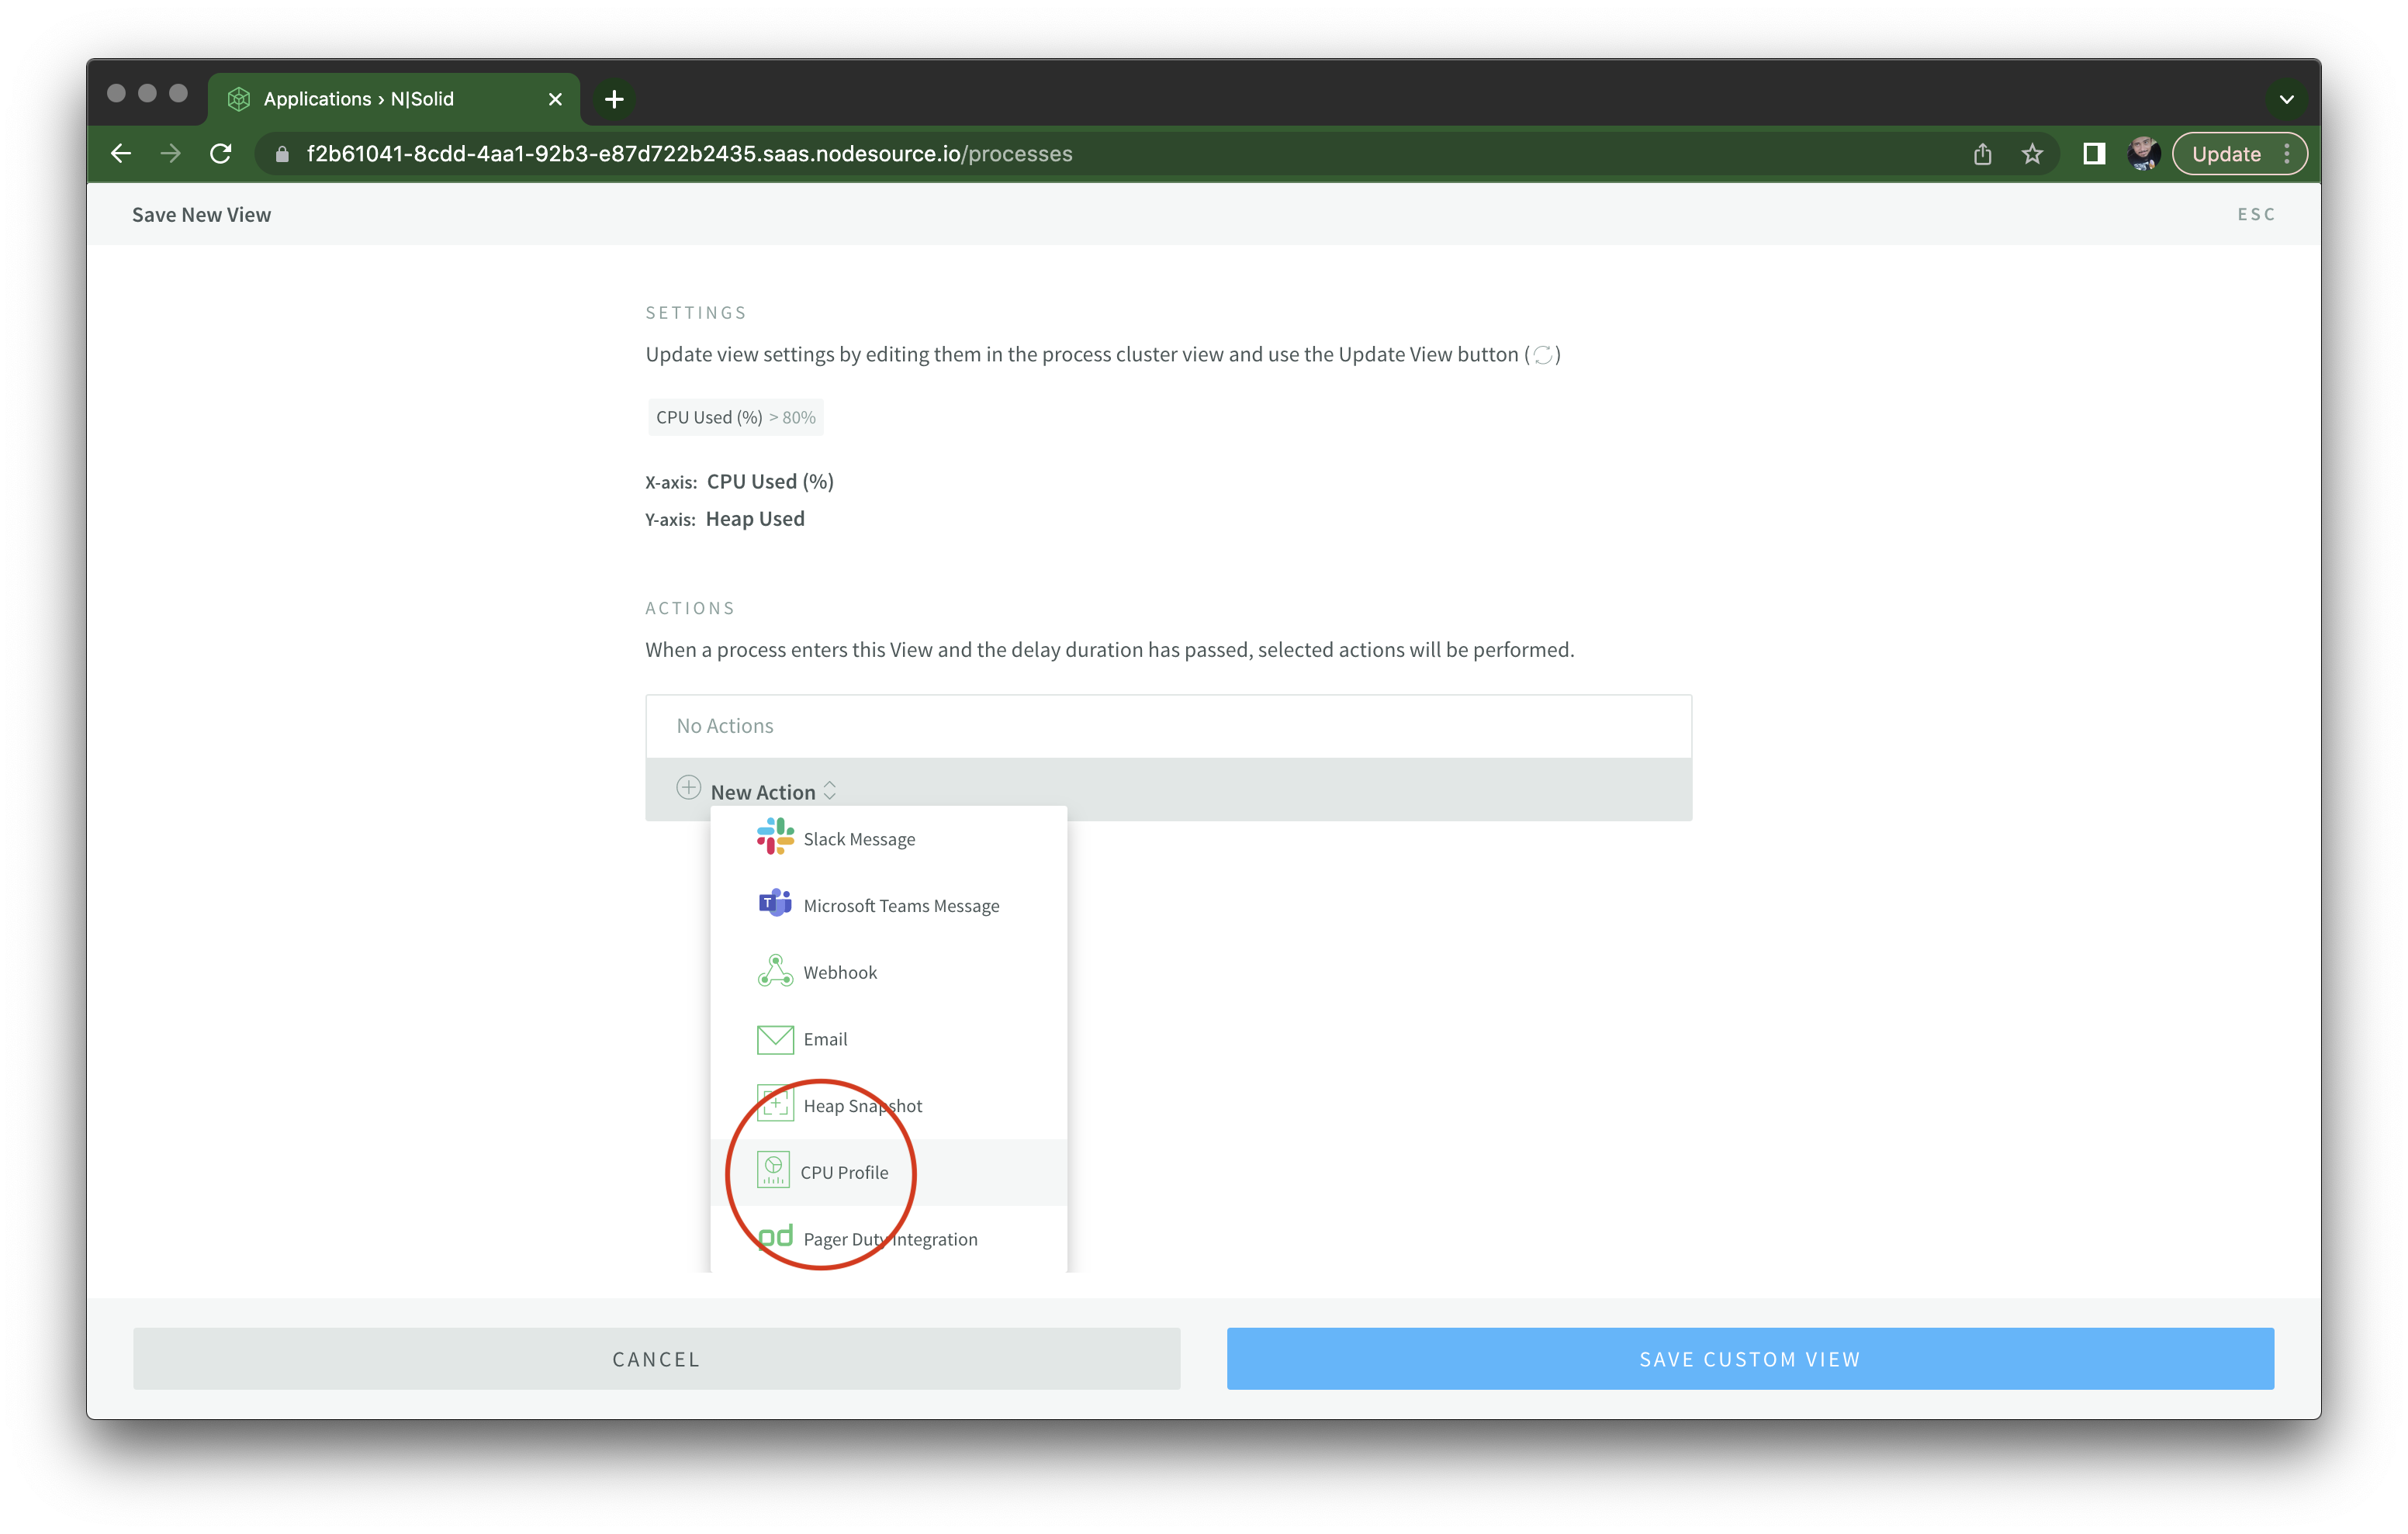
You should see a new modal where you can configure this custom view, and trigger a few types of action, such as sending a Slack message, email, taking a heap snapshot or generating CPU profile. In this case I'm setting it up to take a CPU profile, which can help visualize the frequency and duration of function calls.
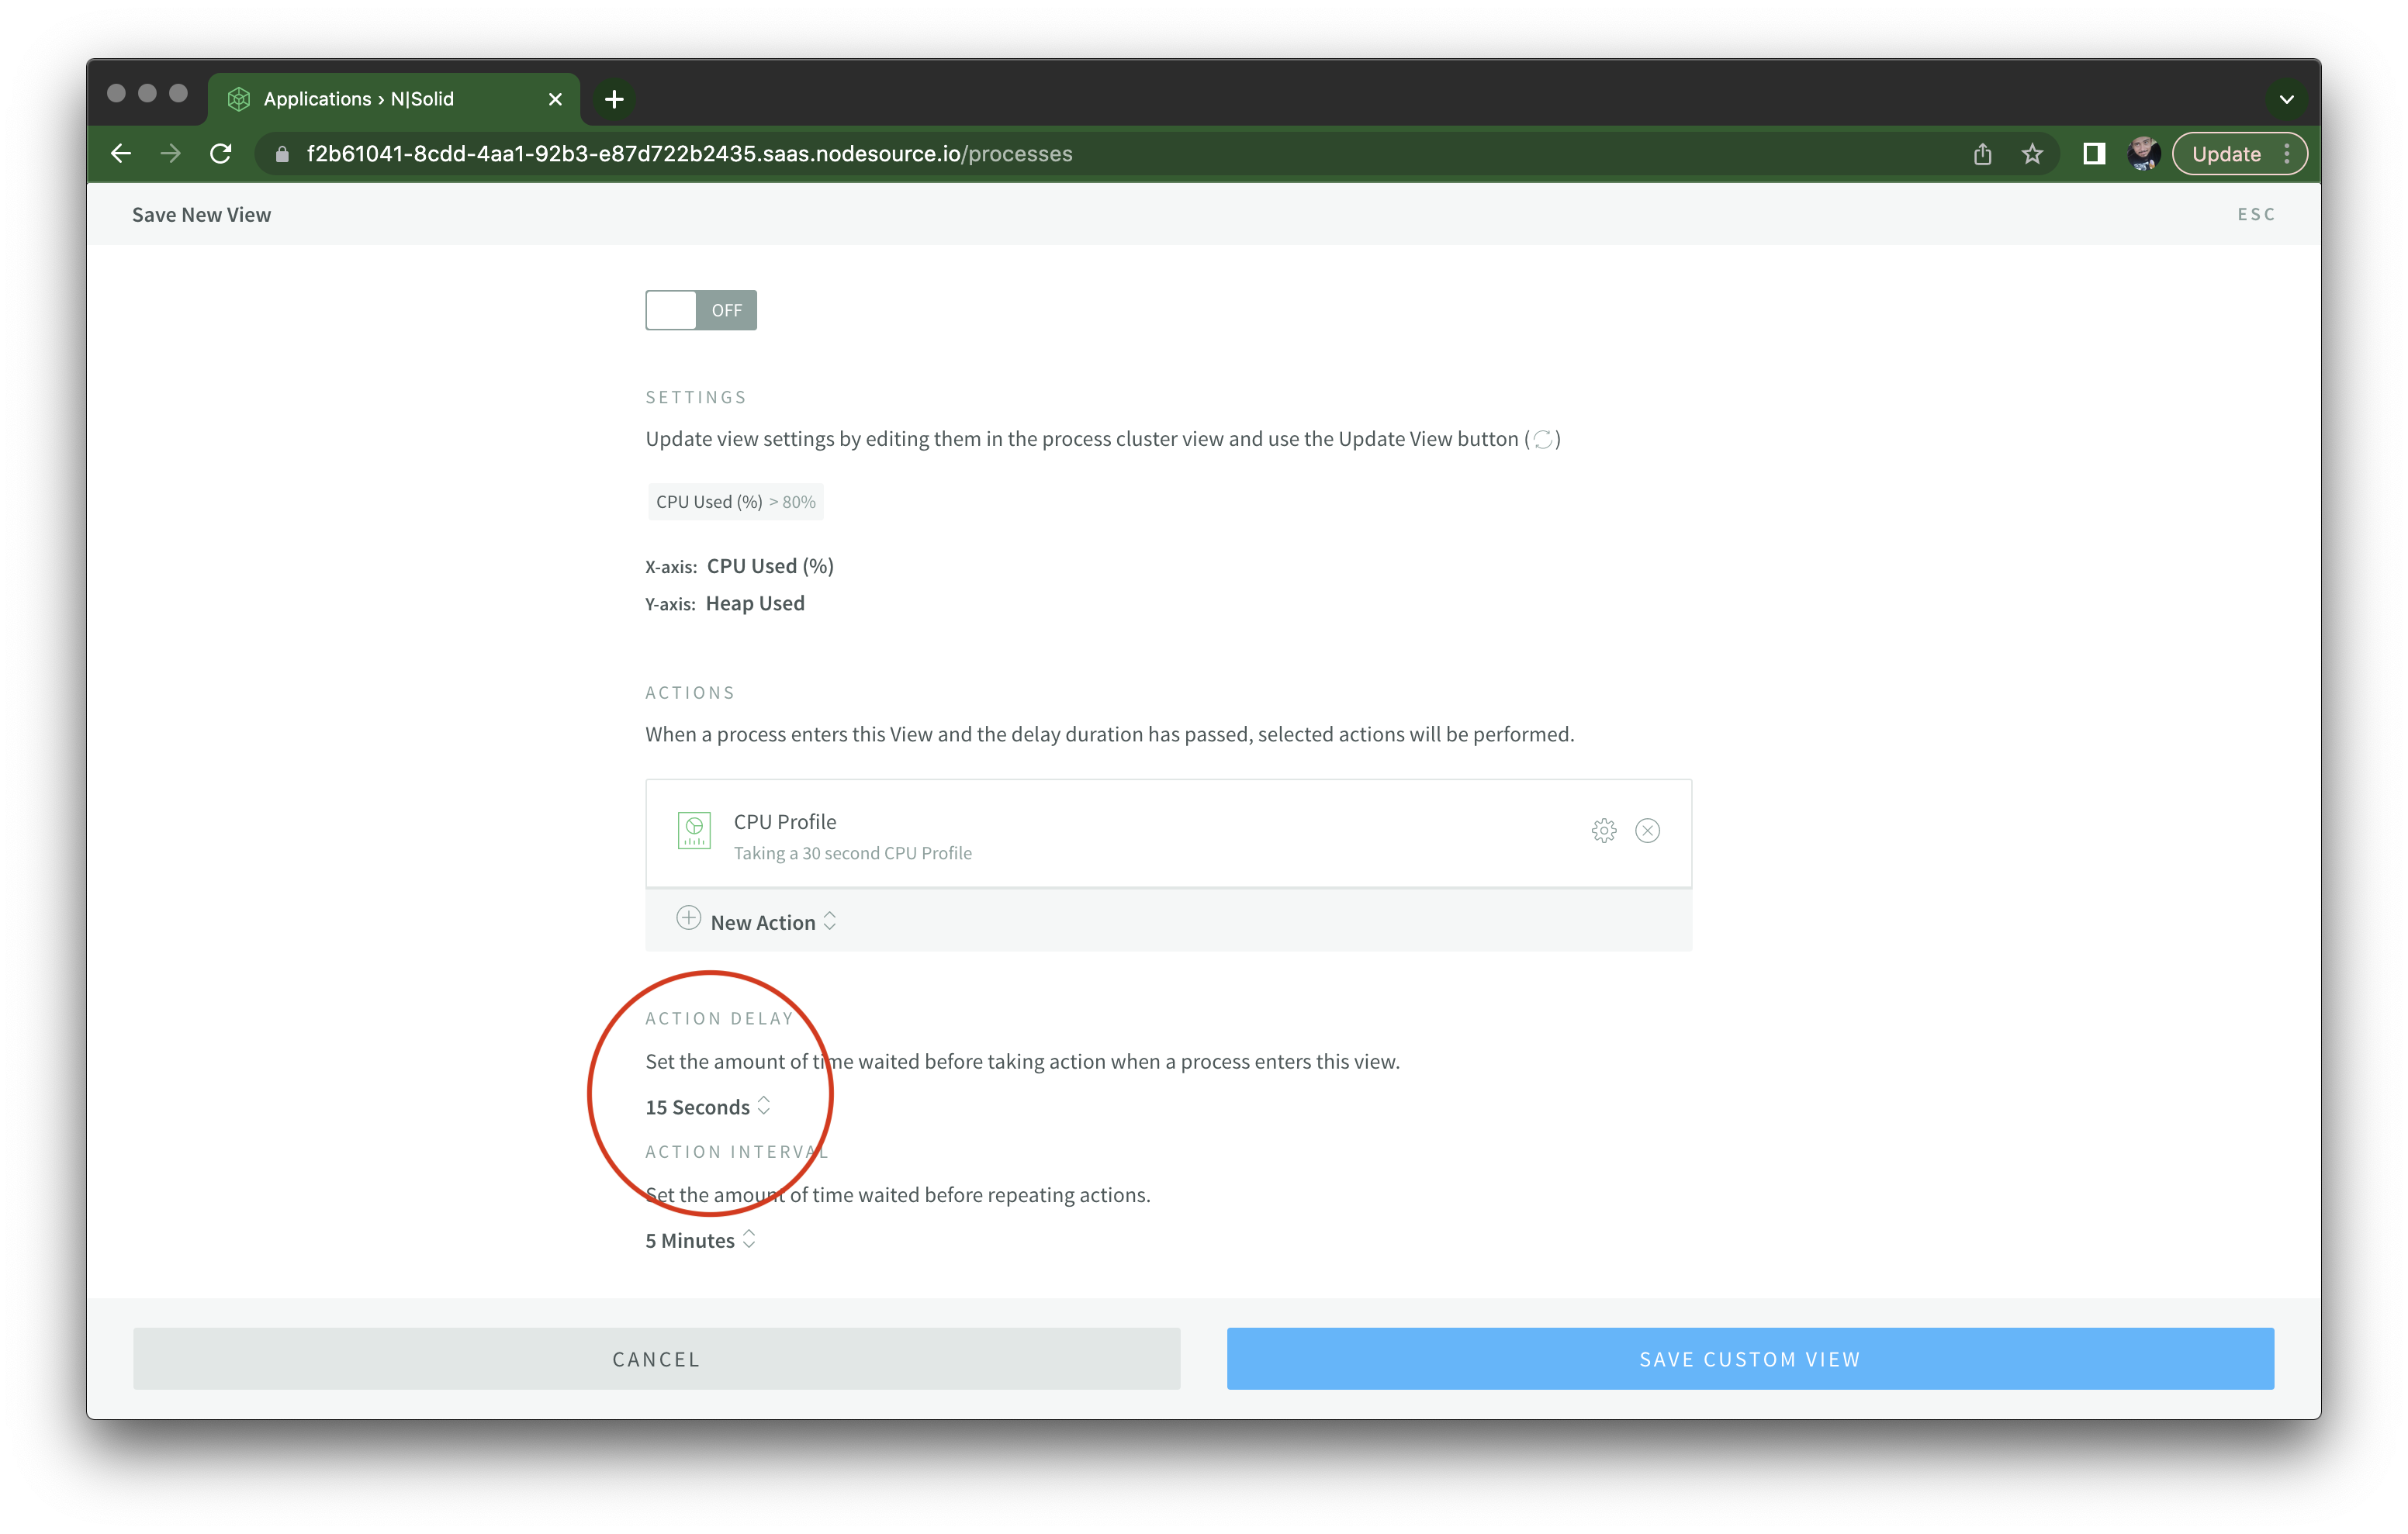
After any processes enter this view and stay on it for at least 15 seconds:
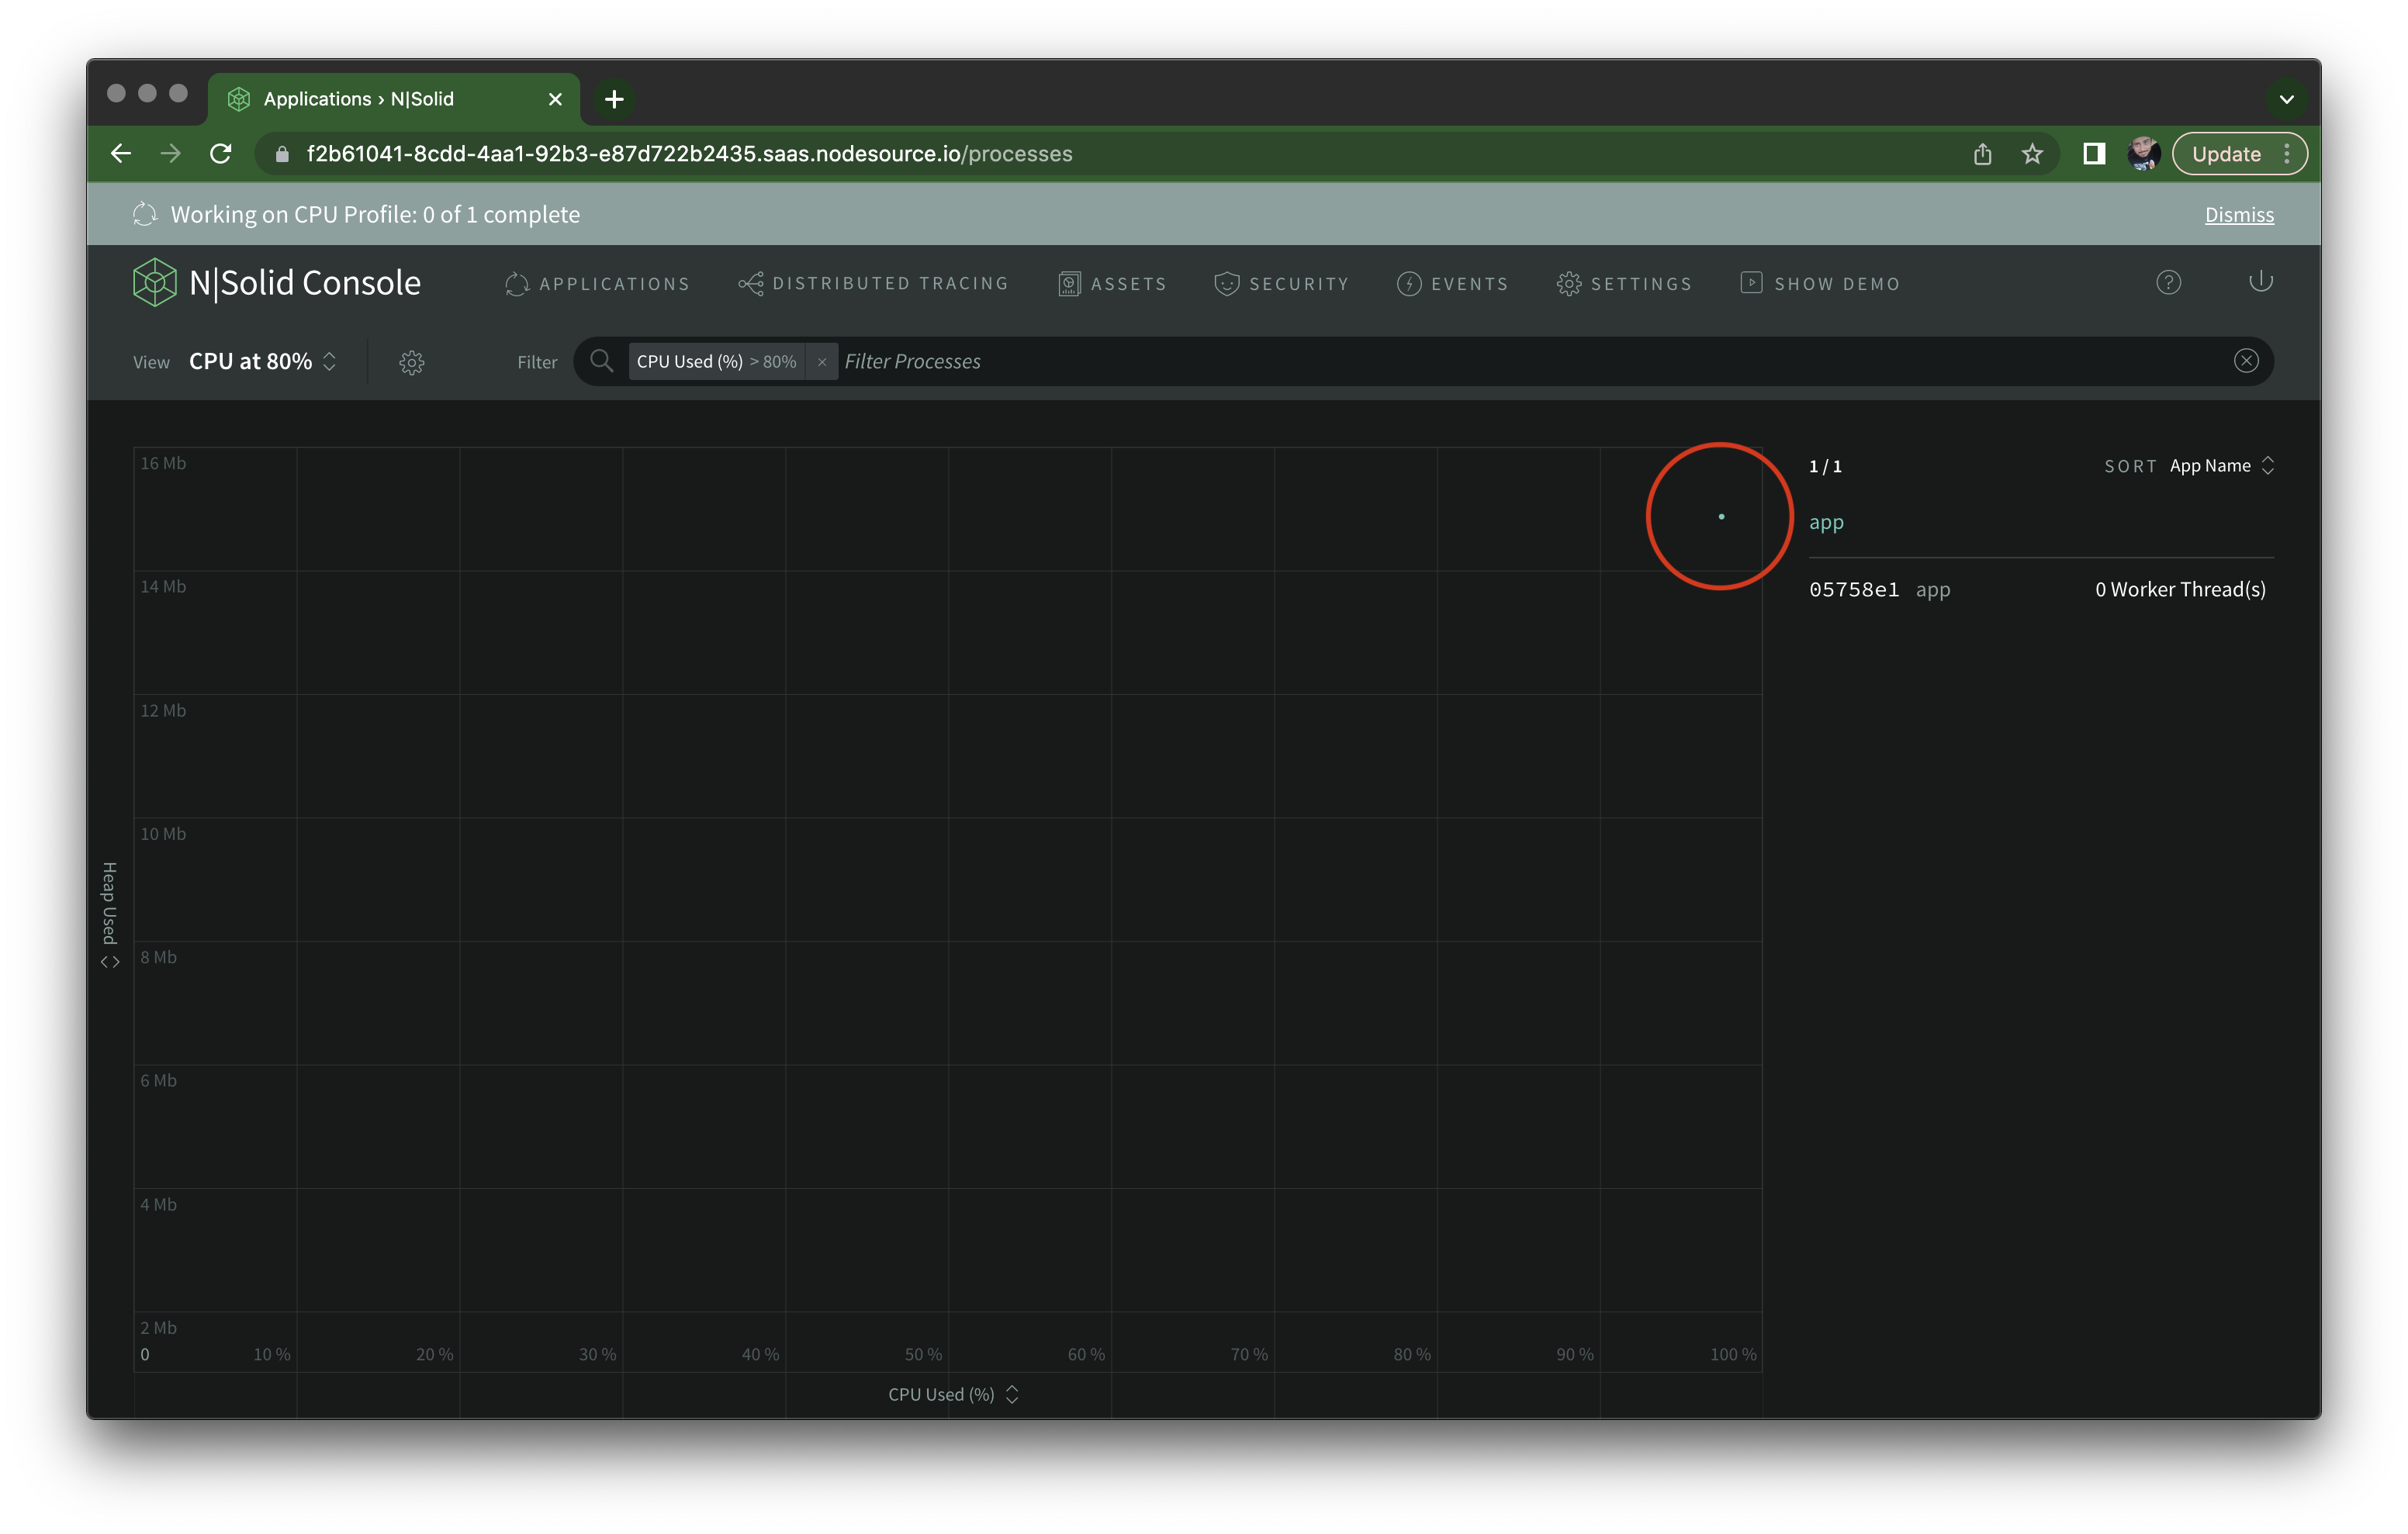
I then run autocannon -d 45 http://localhost:3000/misbehave/cpu and after 15 seconds, I see the message at the top telling me a CPU profile is being created. Notice how the process dot moved all the way to the right on the X axis as well:
You don't have to use the custom view options to create a CPU Profile, it can be created on-demand, but that's certainly a nice bit of automation.
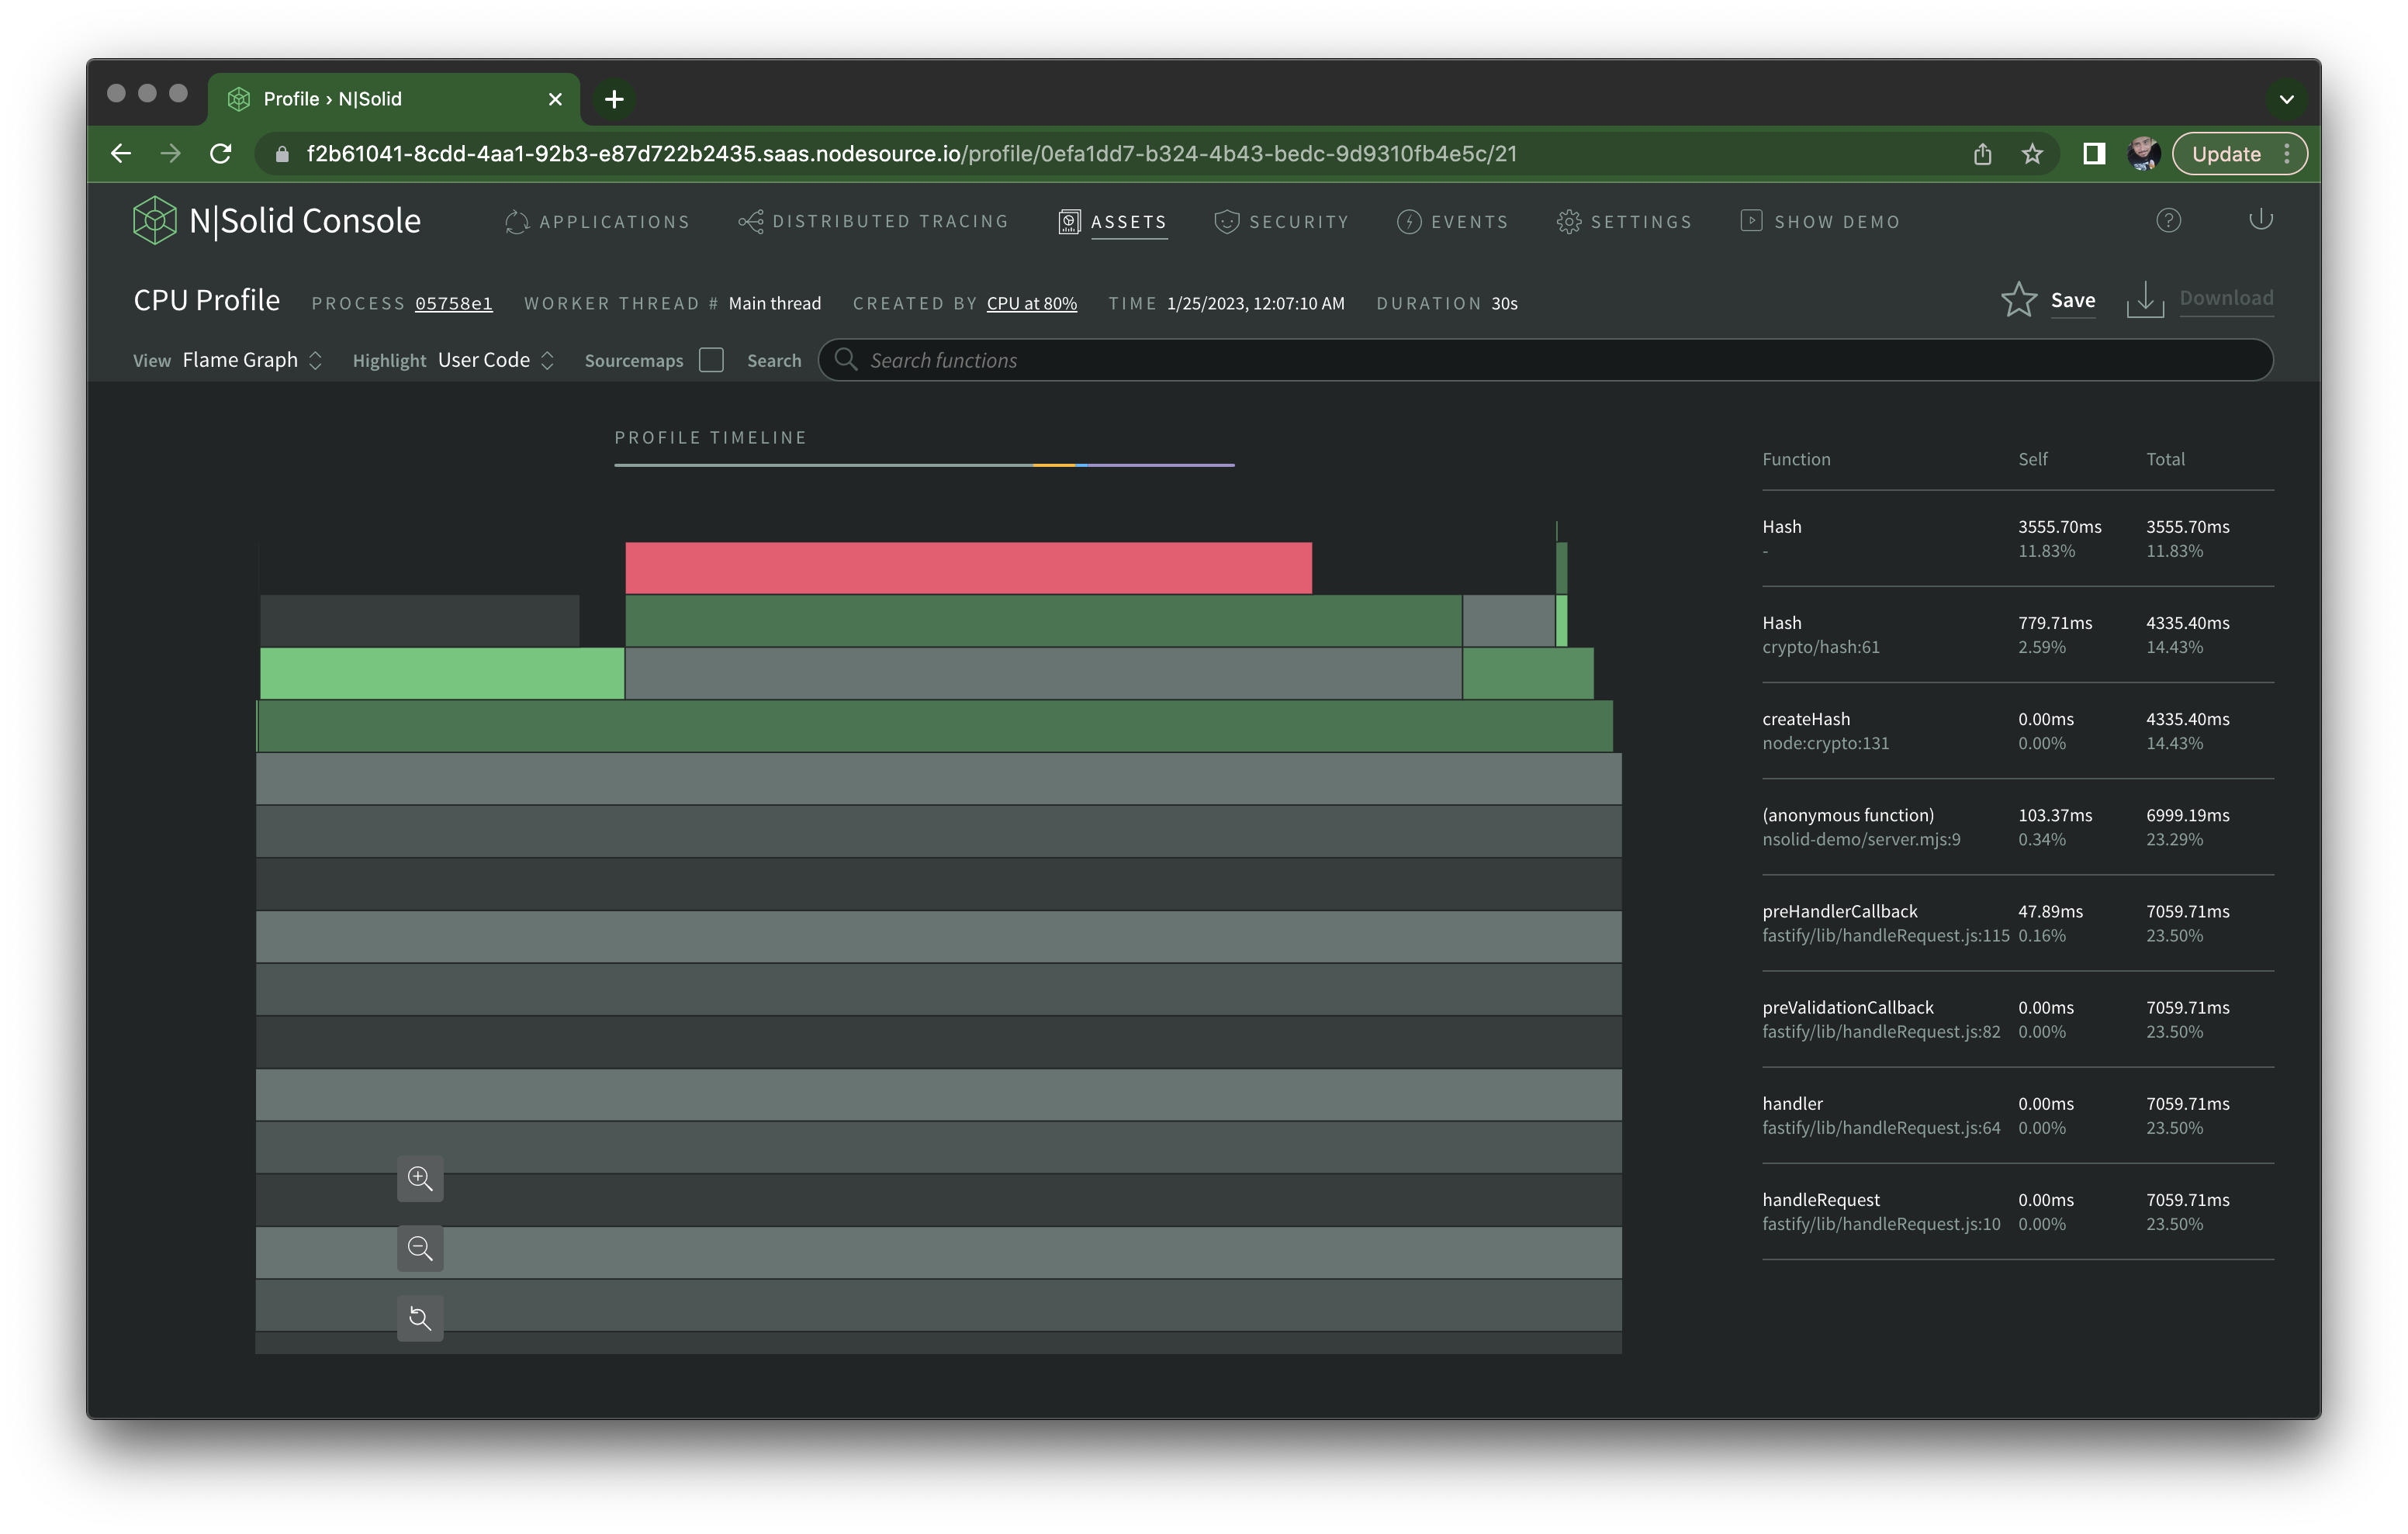
Once it's complete, it becomes available on the Assets tab. CPU profiles can be visualized as a Sunburst Chart, a Flame Graph, or a Tree Map.
Using the Flame Graph view I'm able to quickly identify createHash() (and the underlying native node:crypto) as the culprit of our high CPU utilization:
Personally, I like to use Chrome Developer Tools to visualize these.
You can choose to download the raw CPU profile file and open it from the Performance tab (click the load button right under the Elements tab), which give you much more detailed visualization options if you need to dig deep:
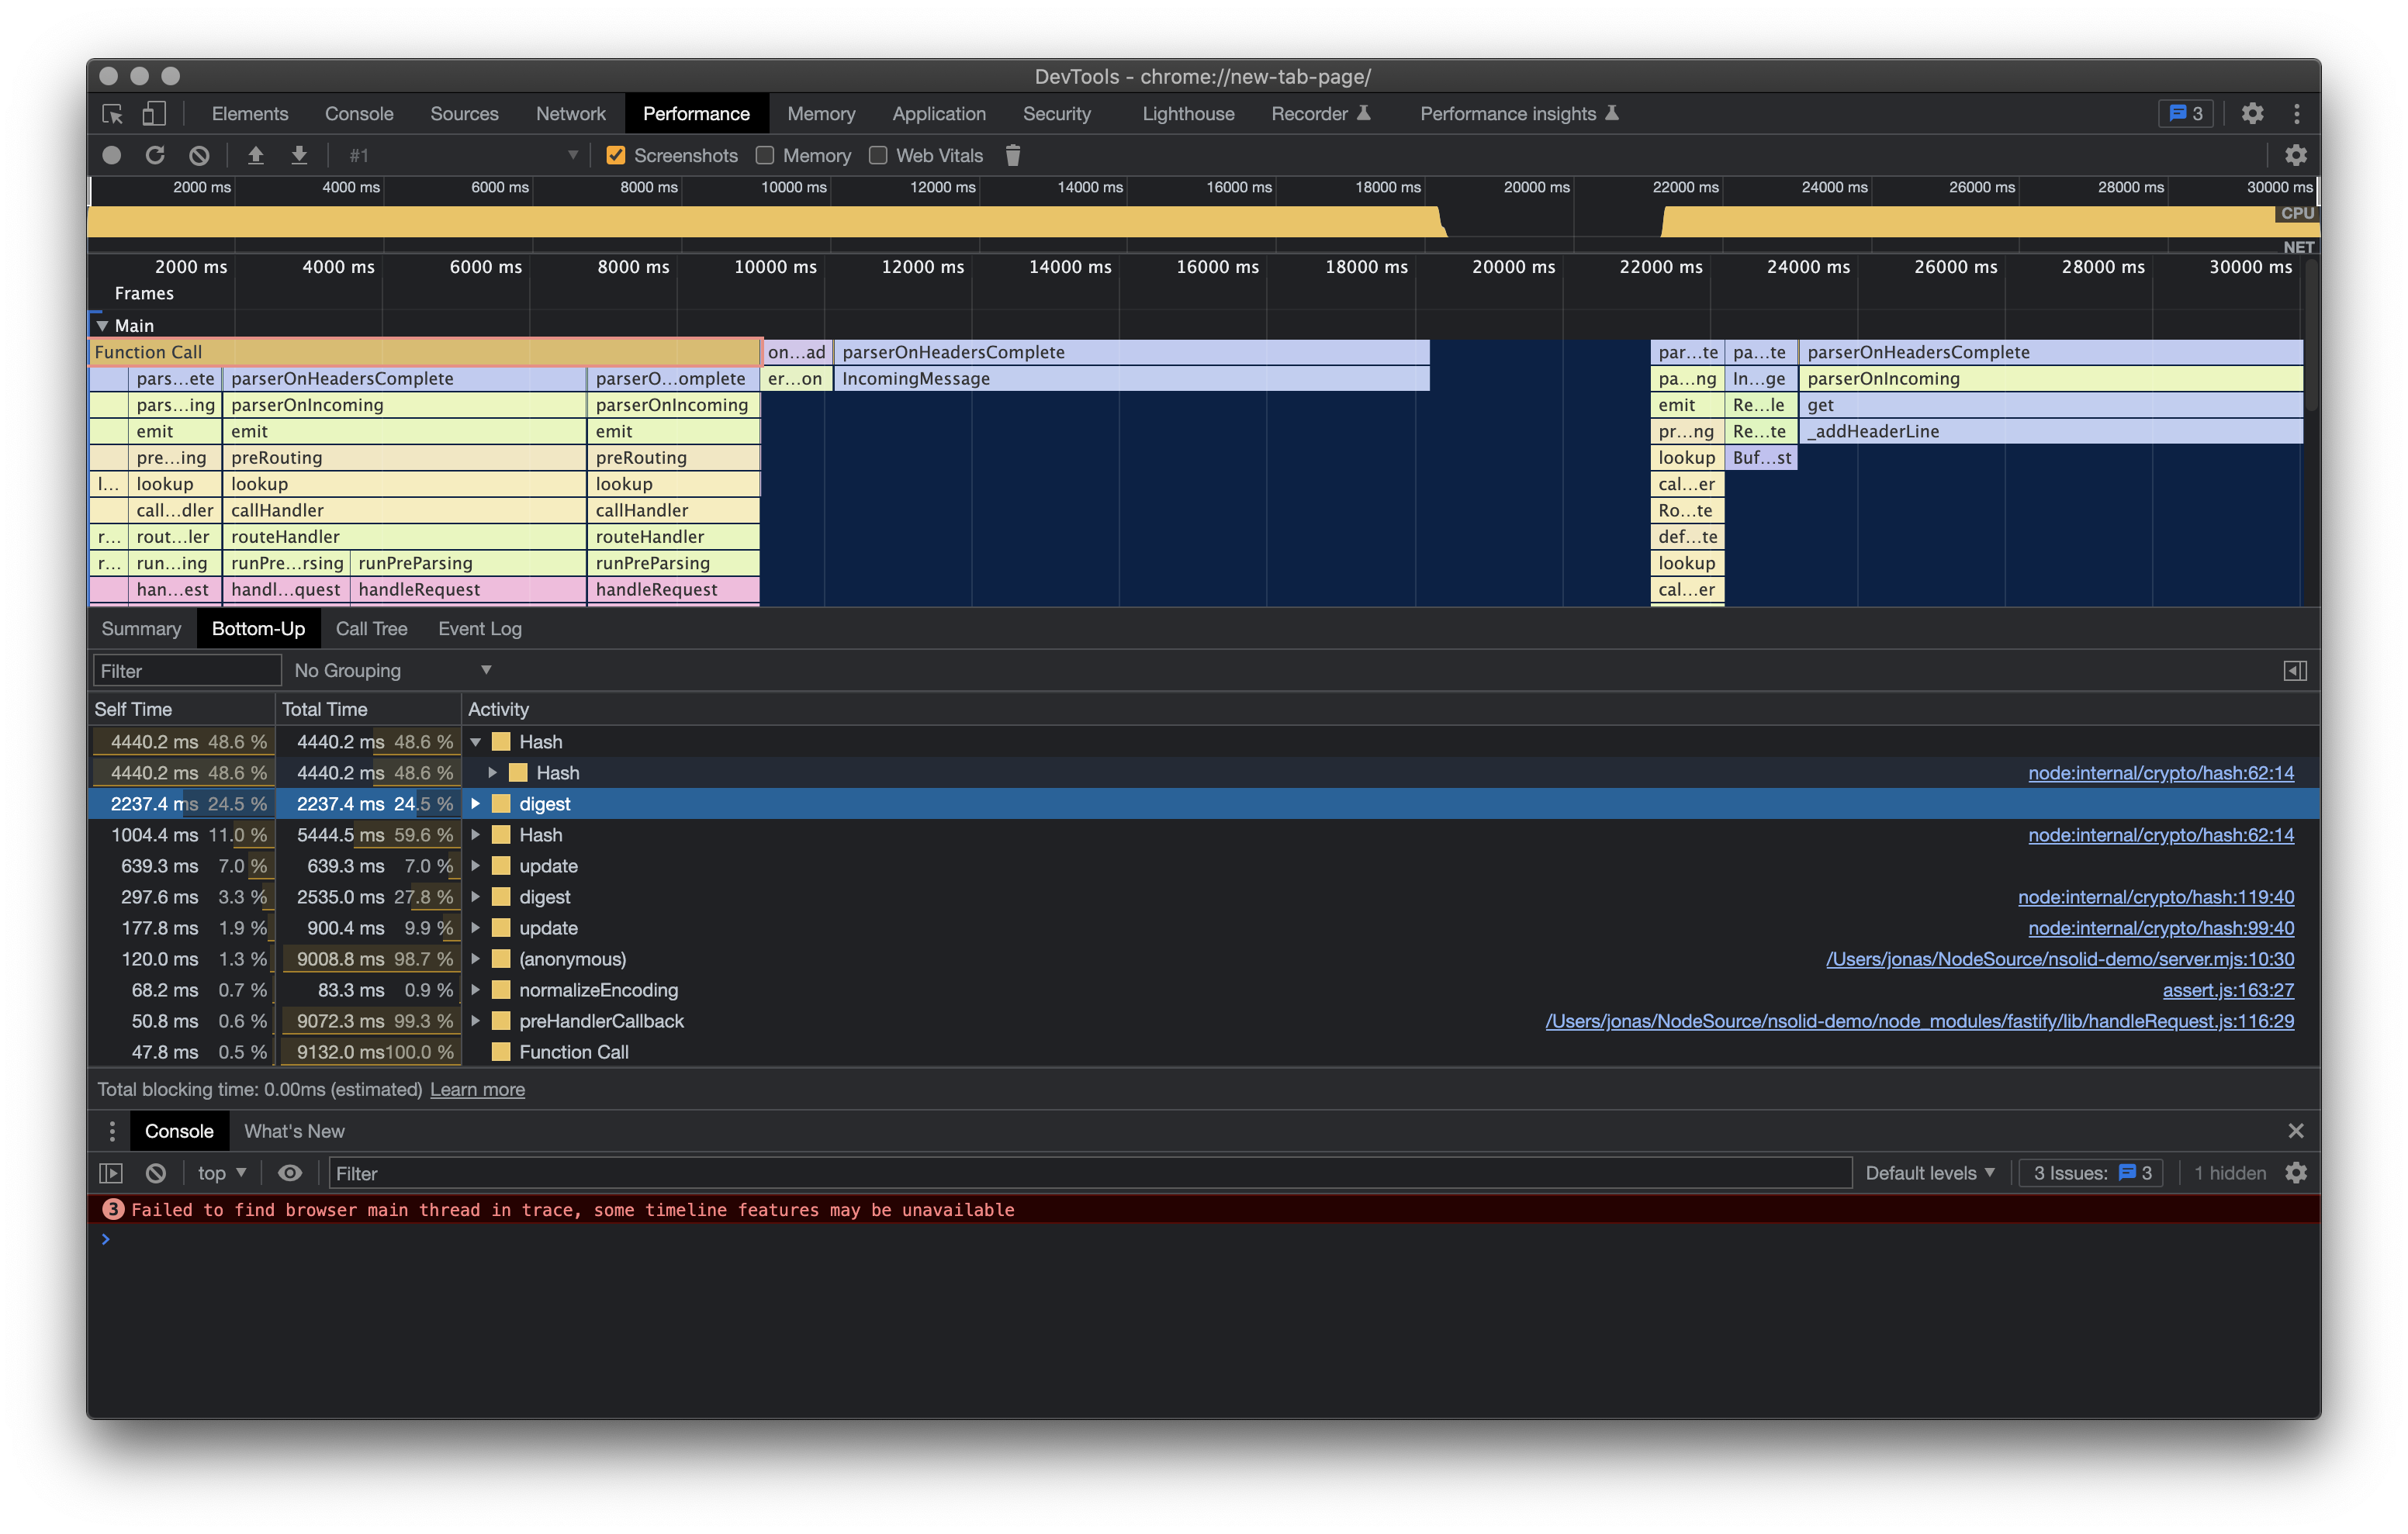
I typically go to the Bottom Up tab which shows top offenders right away.
⁂
N|Solid Console also has the ability to generate Heap Snapshots, both manually and on an automated fashion like I demonstrated for CPU profiles.
Check out this video to learn about how to go about analyzing them.
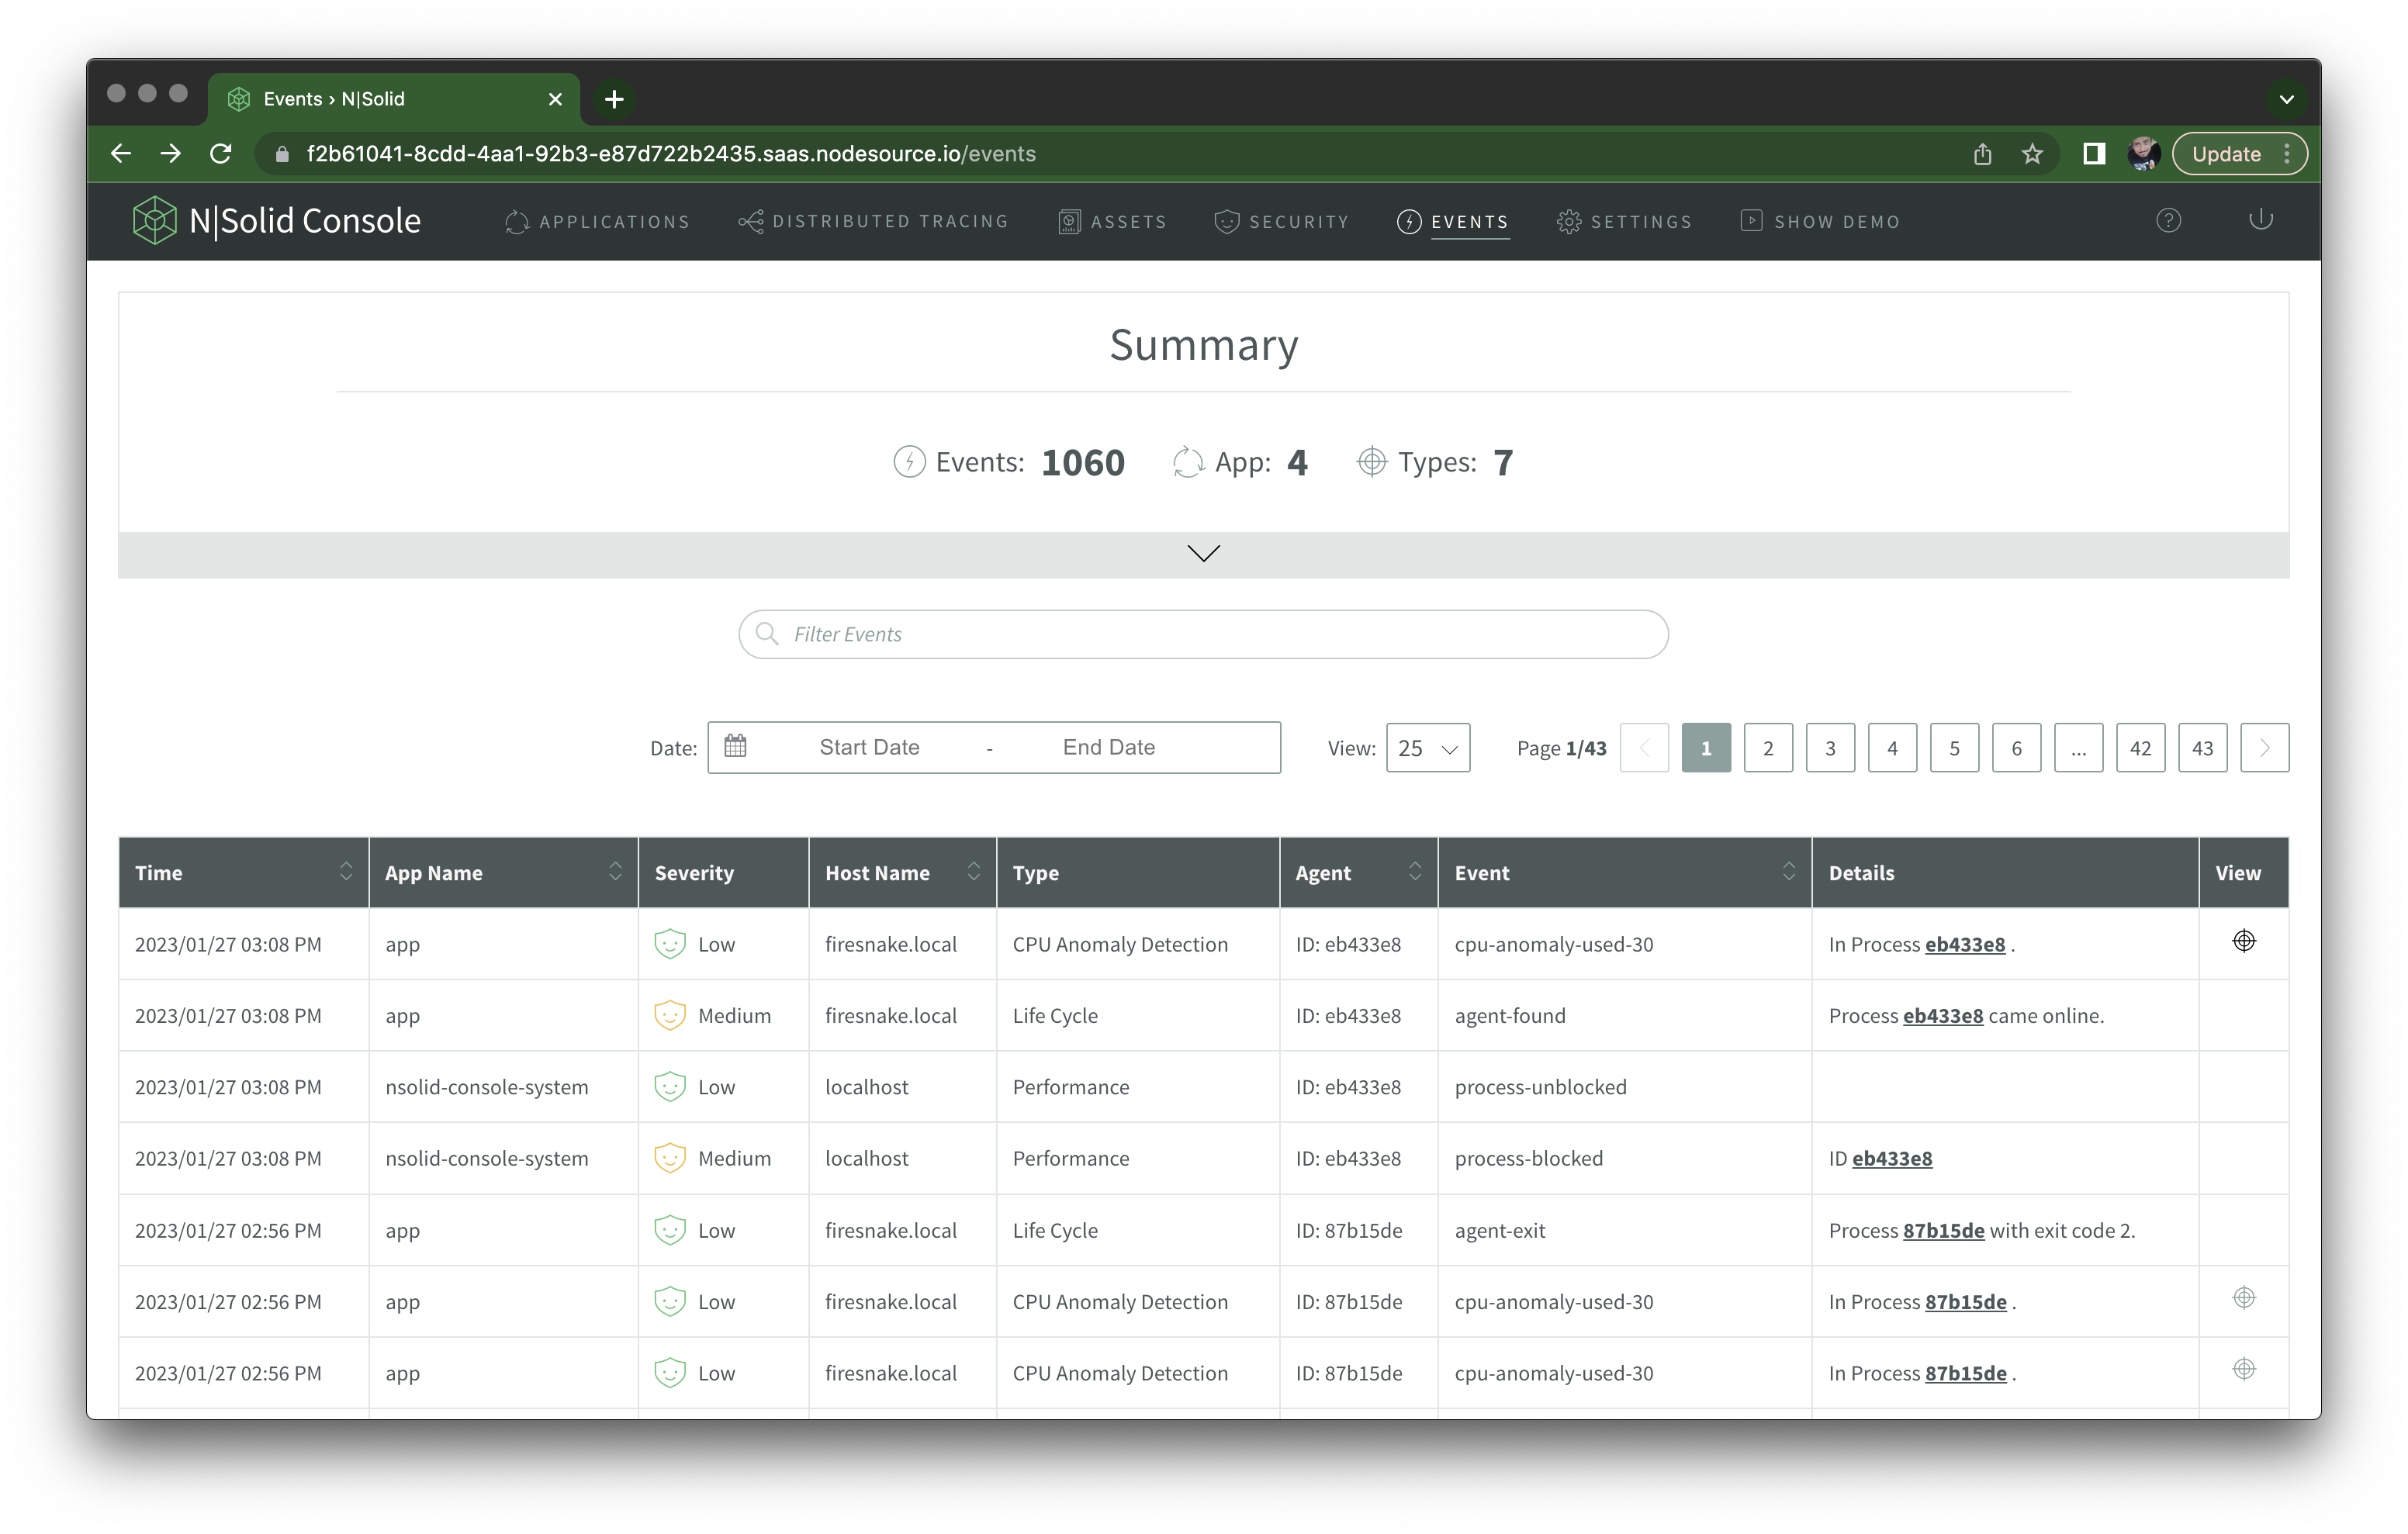
On the Events tab, you get a list of automated events recorded by N|Solid, such as cpu-anomaly-used-30 for CPU utilization above 30%, process-blocked to indicate Event Loop issues, among many others:
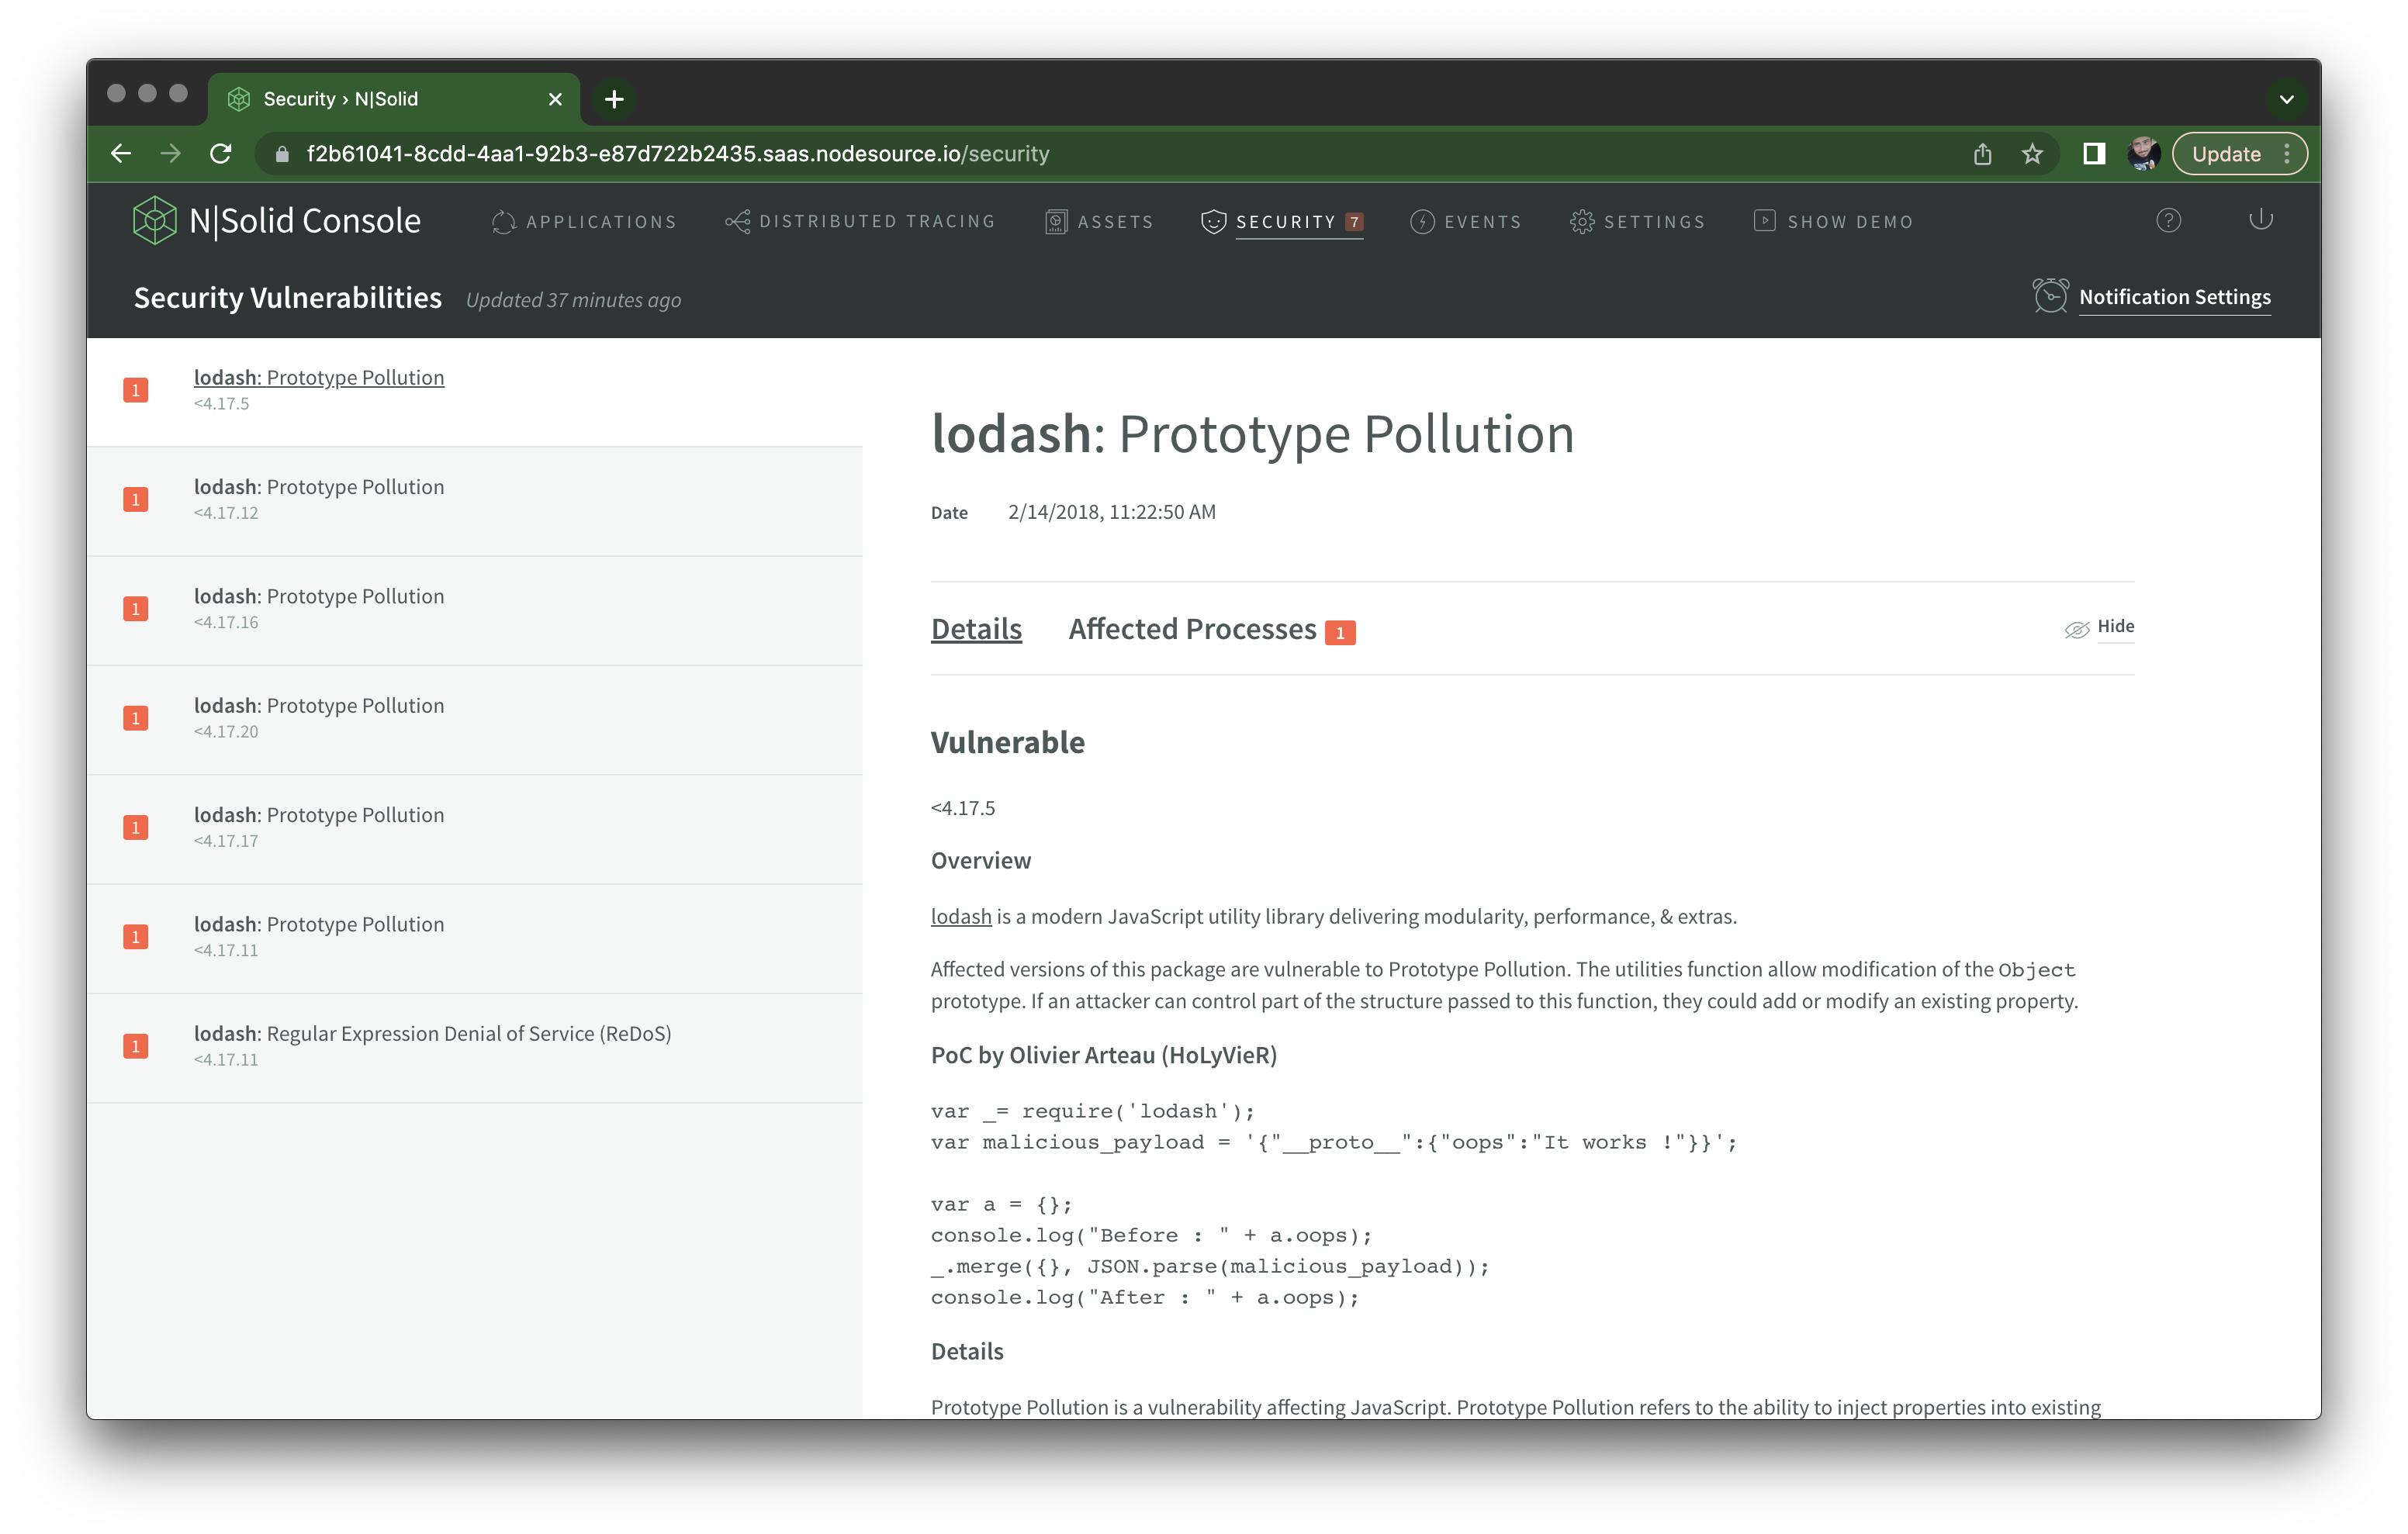
And, although not directly related to performance, if you were to install a terribly outdated library version, let's say, lodash@1.0.0, N|Solid automatically scans your package.json file and shows any uncovered vulnerabilities in the Security tab:
⁂
I may be biased, but to me N|Solid is objectively the most convenient and fastest solution for monitoring Node.js performance, both locally for development and in live deployments — if your business can afford it.
I think though knowing your way around Clinic.js is also a definitive must for Node.js developers, as is having a good understanding of CPU profiles and heap snapshots. The Chrome DevTools docs contain some helpful pieces.
Liz Parody wrote a comprehensive three-part series on Node.js diagnostics (Part 1, Part 2, Part 3) that you should absolutely read.
Also look for Matteo Collina's videos on YouTube — he's given many talks talking about advanced Node.js performance topics. The Unsung Hero Story of Events, Streams and Promises for instance provides many valuable insights.